LUMINESCENT VISUALIZATION OF MOLECULAR AND TURBULENT TRANSPORT IN A PLANE SHEAR LAYER
40 Nutmeg Lane
Glastonbury, CT 06033
ABSTRACT
The purpose of this work is to contribute to the fundamental understanding of fluid turbulence by visualizing its detailed flow structures. Examination of these coherent structures gives information about the turbulent flow that cannot be deduced from its statistics. This information should reduce the role of empiricism in the analysis of turbulence.
The experimental method chosen is to visualize a turbulent plane free shear layer using stop-action photography of a phosphorescing trace gas. Choice of 1) direct photo-excitation, 2) collisional excitation, or 3) collisional de-excitation of the phosphorescencing gas with a planar light beam, permits identification of the emission with a cross-sectional map of the material from one stream that is 1) throughout the flow, 2) molecularly mixed with material from the other free stream (alone), or 3) molecularly unmixed.
The plane shear layer visualized has been specified experimentally. Extant requirements for self-preservation are insufficient in general, and make the claim of self-preservation for the experimental flow only probable and not definite.
A large data set using all three variations of the visualization technique show structures that imply a large amount of new information about turbulent mixing and turbulent processes.
The data shows the structures to be simply connected, with slow variation out of the mean flow plane. Specifically, there is a simply connected region of mixed fluid that always separates material entering the layer from the free streams.
Collisional excitation and quenching data strongly imply a turbulent mixing process of random bursting from the free stream, followed by internal viscous decay. The complementary process of turbulent entrainment is recorded in the quenching photos as nibbling of the free stream by the layer, together with a randomly occurring large local amplification of this nibbling, previously thought to be engulfment by the boundary.
SYMBOLS
c = arbitrary constant
C = concentration
d = distance
F1 = general flow variable
Fv = tabulated mean velocity profile function
h = Planck's constant - 6.626 x 10- 27 erg-sec
I = intensity
ℓ = layer width
ℓK = Kolmogorov length scale
nB = number of Benzene molecules per unit volume
nBD = number of Butanedione molecules per unit volume
n* = number of excited molecules per unit volume
u = velocity of turbulent fluctuations
ui, uj = velocity in the ith , or jth direction
Ue = lower free stream velocity
Us = free stream velocity difference
Uu = upper free stream velocity
x = distance in streamwise direction
y = distance normal to the plane of the shear layer
ε = energy dissipation rate per unit mass ( length 2)/time 3
εa = extinction coefficient
λ = (Uu - Ue)/(Uu + Ue)
μ = coefficient of viscosity
ν = kinematic viscosity
ξ = σу/x
ρ = density
σ = a similarity parameter
-−− = time average
CHAPTER I
Introduction
The aim of this work is to contribute to the fundamental understanding of fluid turbulence by visualizing its detailed flow structures. In this approach, coherent spatial and velocity structures are assumed to result in the statistical behavior of a turbulent flow. Examination of these structures then gives information about the turbulent flow that cannot be deduced from the statistics of the flow.
At this time the analysis of turbulence is semi-empirical. The statistical description of turbulence is well established, and has been explored to the point of exhaustion. Its weakness is that it is incomplete as an a priori analytic tool for predicting the details of the mean and fluctuating properties of a turbulent flow. The gap in the description is filled by various approaches that utilize empirical statements about the flow. Eddy viscosities, mixing length hypotheses, and assumptions on higher order moments of the fluctuating Navier-Stokes equations, are just a few. These involve varying constants, fudge factors, and a good deal of acrobatic mathematics.
Now, however, the deceptiveness of turbulence has been coming to light. It appears that the notion of turbulence as a totally random process is not entirely correct. As the study of turbulent statistics became more sophisticated, researchers began to notice correlations in fully turbulent flows. Discovery of "large eddies" in turbulent flows marked the beginning of the physical understanding of turbulence. What has hindered this progress is the belief that since turbulence is random, it is not useful to know the specific dynamics that cause the motion.
This view is still pervasive.
Kolmogorov, who deduced a lower limit on turbulent motions, may be looked upon as the originator of what is known as the structural approach. From his work developed the notion of an energy cascade from large to small "eddies" and thence to viscous dissipation as heat.
Paralleling the statistical description is the phenomenological approach. Prandtl's mixing length hypothesis is foremost among these attempts at completing statistical analyses. Unfortunately, this approach has been found to be of limited value because its models are not rigorous enough. These phenomenological theories are united by their imprecision, and their lack of detailed experimental foundation.
Viewed in this light, the structural approach to turbulence is one logical direction to proceed to complete the statistical analysis of turbulent flows. It only awaits adequate experimental techniques.
This work demonstrates part of the tremendous potential of the structural approach to turbulence through the application of the phosphorescent gas visualization technique to a plane shear layer. The use of direct photo-excitation, collisional excitation, or collisional de-excitation of a phosphorescing gas in one stream by a planar light beam gives data from which deductions can be made that give fundamental new information on turbulent processes.
CHAPTER II
The Flow
2.1. A Plane Shear Layer:- the best way to study turbulent structures.
Analysis of different turbulent flows seems to indicate that a plane shear layer is the best flow to examine to find a general coherent structure of turbulence.
As in many flows, the turbulence in a plane shear layer becomes self preserving far enough from the origin of the layer. Here self-preservation means that flow variables are only a function of local properties:
F = f(y/ℓ)
This condition refers only to the statistical properties of the flow, but these properties must become independent of the specifics of the apparatus before the structures do. Implications about the flow go from structures to statistics. If the structures are self-preserving, the statistics must be. However, in practice, if the statistics are self-preserving the structures need not be, since the specification of the statistics is always incomplete. Specifying all of the moments of the fluctuating quantities specifies those quantities, but at this time there is no way of knowing how many of the infinite number of moments must be determined.
An illustration of the insufficiency of statistical self-preservation is seen in the mean velocity profile of the flow, one of the simplest statistics of the flow. These profiles come to equilibrium long before the flow is self-preserving in the current full statistical sense. [1]
Looking beyond basic self-preservation, a plane free shear layer has two properties that are crucial for the existence of a fundamental turbulent structure. First1the boundaries of the turbulent layer are determined by the turbulence itself, rather than being a constraint on the internal structure. Second, the turbulence is maintained by a constant energy input from the mean flow, so that the structures should be in dynamic equilibrium.
Implicit in the first property is the assumption that there is one universal structure involved in turbulence (perhaps a few). This structure would take on different forms for different flows, depending on the constraints placed on the particular flow. To examine this universal structure one chooses its most undistorted form, i.e. free boundary conditions. [At this point it should be made clear that structure refers to coherence in velocity space, position space or both.] Furthermore, some external constraints on the origin of the flow impose spurious structures on the flow. An example of this is the extreme persistence of shed vortices in wake flows. Initial conditions of a free shear layer take the form of an initial momentum thickness, which can be reduced to a small value by boundary layer suction.
The second property concerns turbulence as an energy transfer process from the mean flow to heat (viscous dissipation). The transfer is steady only for constant energy input, e.g. from the fixed velocity difference of a free shear layer. Any universal structure must develop from some initial state asymptotically to its final form. This structure must be inherent in turbulence as a momentum transfer process, and therefore should only develop to the final state if the driving force is kept constant. In other words, the structure must develop in dynamic equilibrium.
The existence of a universal structure cannot be taken for granted. Contrasted with a plane shear layer are jets and wakes, which have a constant total kinetic energy surplus or deficit with respect to the main flow that diffuses and is gradually dissipated by viscosity. Both these flows become self-preserving in the sense given above while the turbulence itself is decaying. It is possible that there is a unique structure for each type of flow.
There does not seem to be a general argument for or against a universal structure for turbulence, aside from the assumption that the fact of its stochastic behavior makes it impossible. This assumption seems to be false, from examination of the data presented in Appendix II.
A plane shear layer has the added advantage of geometric simplicity, implying two-dimensionality for the mean properties of the flow. The turbulent structure itself is highly three-dimensional, of course.
2.2. Description of a Plane Shear Layer
A plane shear layer has two types of fundamental boundary conditions. One concerns the flow outside the shear layer and undisturbed by it; the "free streams" are specified by their velocities and their turbulence levels. The other type is the specification of the flow at its spatial origin. This specification consists of the location of the end of the physical separation (splitter plate) between the two free streams, together with the description of the flow that first separates these free streams in the form of shed boundary layers from the splitter plate.
These conditions are adequate to specify the mixing layer completely in the ideal case. However, it seems there are no a priori statements about mixing layer properties that can be made as of this writing based on a knowledge of these conditions. None at all.
Given that the mixing layer has been experimentally shown to be self preserving in the sense defined above, the layer width then can be shown to be: ℓ= cx from the point of self preservation onward. Furthermore Goertler was able to derive a form for the mean self-preserving velocity profile based on Prandtl's mixing length hypothesis
u/[(Uu+ Uℓ)/2] = 1 + λ erf(ξ) + Σλ vF'v(ξ) from v = 2 to ∞
ξ ≡ σу/x (σ ≡ similarity parameter)
λ ≡ (Uu - Uℓ)/(Uu - Uℓ)
F'v is a tabulated function [3]. This is useful because it agrees well with v experimental measurements despite the limitations of the assumption.
These predictions are of little use to an experimentalist trying to predict closely the behavior of a particular shear layer. The unspecified aspect of the shear layer is the developing portion, where the layer grows more rapidly than it does when self-preserving. [3] Furthermore, the length of this region depends in an unknown way on the initial momentum thickness at the end of the splitter plate, the absolute velocities of the free streams, their velocity difference, and the free stream turbulence level.
Fortunately, despite the lack of progress from fundamental principles, there has been a great deal of progress in understanding the physical processes involved in turbulence. This physical understanding has proceeded by various independent paths, almost none of them based on the assumption of some coherent structure within the turbulence itself.
The phenomenon of turbulence that emerges is complex. Its aspects occur within a statistical framework, but many are definitely not implied by the statistics, like the coherent structures considered here.
The best way to begin explaining the understanding of turbulence as applied to a plane shear layer is to state the quantities almost always used in the statistical description of the flow. The basic approach is one of separating the flow into mean and fluctuating components. For a constant density (and constant temperature) flow, the quantities used at first seem to be the same as for other flows: velocity, pressure and kinetic energy. Contrary to fluid motion in general, however, vorticity is an inherent and fundamental characteristic of turbulence, on all scales of the flow.
Particular turbulent flows are seen primarily in the light of mean quantities such as velocity, position and spreading. Fluctuating quantities have almost gaussian distributions, confirming the random nature of the turbulence. The divergences from the normal distribution are necessary theoretically to explain many aspects of turbulence, such as growing vorticity. Thus, while the mean fluctuating quantities are zero by definition, averages of moments of these quantities are often non-zero and sometimes can be given physical interpretations. The most common of these is uiuj, where - denotes time average. The collection of these terms makes up the Reynolds stress, a fictitious shear and pressure tensor arising from the fluctuating quantities in the mean Navier-Stokes equations. au.
Many other correlations are used and measured. Terms of ui ∂ uI/∂ yi are the only quantities of competing importance, as the moments become of higher and higher order and more and more obscure. Similar moments of vorticity are not common, apparently due to the lesser physical understanding of vorticity and its dynamics.
An immediate consequence of considering fluctuating quantities is the analysis of their frequency spectra, i.e. Fourier analysis. The decomposition does not necessarily mean that turbulence is a wave phenomenon. Turbulent motions can be split up into various frequency domains where, in particular, the turbulent energy varies as a different function of frequency. This result comes from physical arguments about the interaction between turbulent elements within the flow that have different spatial frequency.
In this way, the notion of a turbulent "eddy" was formed to represent turbulent motion of a certain length scale associated with a frequency. The idea of an eddy as a coherent physical entity has been carefully avoided, as is the case with the wave description. Turbulence in a shear layer does have an obvious variation in scale. Motions are seen to vary from those involving the entire layer, to a scale where viscosity prevents steeper gradients in velocity. This scale, the Kolmogorov length scale, is a property of the fluid and the rate at which energy is dissipated.
ℓk = (υ3 /E )1/4
υ = kinematic viscosity E = energy dissipation rate per unit mass.
The two natural scale extremes form the ends of an entire spectrum of eddy sizes. Furthermore these eddies, consistent with these scale limits, form an energy transfer cascade. Energy is first extracted from the mean flow by the large eddies, then it is continuously transferred down the scale range to the smallest eddies where it is finally dissipated as heat by viscosity.
Just as the mean flow provides energy to the turbulence, it supplies the fluid that enables the layer to grow. The energy transfer process results from the straining of the vorticity within the turbulent layer by the mean flow field. The process of fluid addition, called entrainment, proceeds by two processes [4]. The first appears to be a large scale engulfing of fluid in the free stream by the layer. The second is a slower nibbling of the free stream by the diffusion of the boundary of the turbulent layer.
The boundary of turbulent fluid is the transition from the turbulence inside the layer to the potential flow in the free stream. Unexpectedly, it is sharp and continuous, denoted by large gradients of vorticity. [5] It is also highly convoluted, and forms a region of the mean flow that is occasionally turbulent. This region, contrasting the interior fully turbulent flow is described as intermittent. The intermittency is again approximately gaussian.
Lastly, the effects of the turbulent layer are not confined to the layer itself. The flow outside the layer, although distinct from the layer because of the lack of vorticity, does undergo irrotational fluctuating motions caused by the varying turbulent boundary location.
The sum total of the present physical understanding described above is part of a unified whole, unique to turbulence. The description here proceeds in a connected manner, but the characteristics discussed are disjoint parts of the present analysis of turbulent flows.
2.3. Self-preservation of a Plane Shear Layer
When searching for general flow structures in a plane shear layer, it is crucial that the flow be self-preserving at the point of examination. Unfortunately, the criteria for attaining self-preservation have not yet been resolved.
There are two presently used conditions for determining when self-preservation will be reached. The first and oldest is that the Reynolds number, based on the velocity difference and the distance from the end of the splatter plate, be greater than 4 x 10⁵. A more recent and more stringent condition of 1000 initial momentum thicknesses downstream has been proposed by Bradshaw [6]. Neither of these conditions are sufficient by themselves.
The basic question is: how long is the developing segment of a plane shear layer? A specification of Reynolds number as above assumes that the achievement of self-preservation is a case of full transition from laminar motion to turbulent motion. The first iteration on this theme was made when it was realized that some laminar motions such as large vortices persisted in a modified form well after the apparent transition to turbulence had taken place. The criterion was then modified to one demanding that any initial structure should have sufficient distance to be obliterated by the truly turbulent motions.
Later, Brown and Roshko [7] achieved some striking visualization of coherent waves in a plane shear layer. They satisfied the Reynolds number criterion, but not the initial momentum thickness criterion. On further inspection, they discovered transition effects downstream, even though the velocity profile they had found was self-preserving.
In a critique of their work, Chandrasuda and Bradshaw [8] bring in another pertinent effect: the free stream turbulence level. The exterior turbulence partially controls the transition to turbulence of the layer. Turbulence in the free stream tends to randomize the initial layer, and provide the developing layer with entrained fluid that is partially turbulent.
There is yet another effect to be considered. The length needed to achieve self-preservation, is also controlled by the absolute stream velocities through simple convection of the developing layer.
All these four criteria must be applied together to get a true indication of self-preservation, although one or two will usually be more stringent than the rest. The worst combination of the four, in terms of distance from the splatter plate tip to the approach of self-preservation, is large absolute velocities with a small velocity difference, extremely low free stream turbulence levels, and a large initial momentum thickness. The best case in the same sense is just the opposite.
At this time, the best that an experimentalist can do is exceed all the known criteria, and document the four relevant quantities, awaiting a definitive answer about when the shear layer becomes self-preserving.
2.4. Specification of the Experimental Plane Shear Layer
For a real shear layer inside a wind tunnel, more boundary conditions than the flow at the plane (of the splatter plate tip must be given to uniquely determine the entire flow field downstream. The walls containing the flow and the tunnel exhaust may both have an effect on the layer. Furthermore, the experiment described here uses a blowdown wind tunnel, making the time history of the flow crucial for knowing that the shear layer has reached its steady state form when the visualization is done.
The blowdown wind tunnel is shown in Figure 1. At the time of the test, it generates two uniform, parallel streams at the streamwise location of the splatter plate tip, each with a velocity of 0 -10m/sec. The turbulence level in each stream is 3-4%. The initial momentum thickness shed from the splatter plate is measured to be ≈ 2.0mm by a hot wire anemometer for 5m/sec stream speeds.
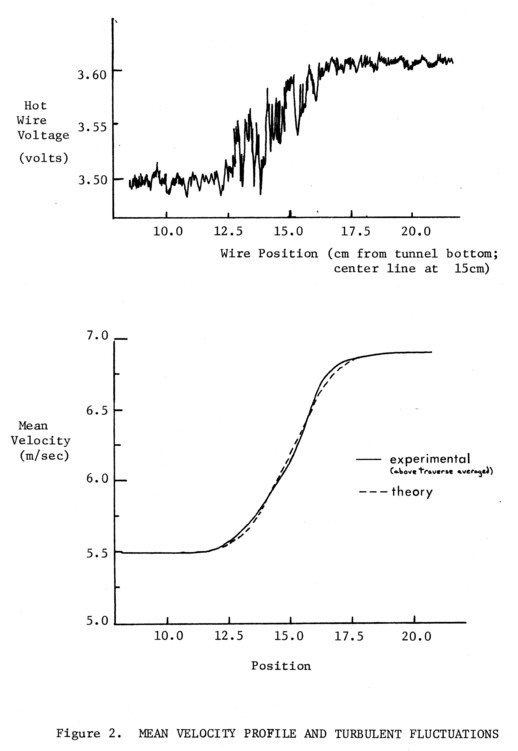
At the center of the visualization view, 96cm downstream of the splitter plate tip, the flow has been accelerated about 7% due to boundary layer growth on the 30cm. diameter, cylindrical tunnel walls. For the same velocities of 6.0 and 7.0m/sec used for most tests, the mixing layer is about 3.0 cm thick (95% of free stream velocity). The measured mean velocity profile for these conditions is shown in Figure 2, together with a traverse of the layer that shows the turbulent fluctuations in the flow, and the position of the layer.
For the above nominal flow, the implications for self-preservation can be summed up. The Reynolds number at the inspection station is
Re = ρ Usx/µ ≈ 7 x 10⁴ (Us = velocity difference) for the bulk gas, Argon. The center of view is 500 initial momentum thicknesses downstream. These numbers tend to imply self-preservation has not quite been reached by the above present requirements. However, the high turbulence level of 3-4% of the free stream velocity (20-30% Us for 6 and 7 m/sec flows) would indicate earlier self-preservation. This is also true of the low flow velocities. Thus it seems reasonable to assume the flow is self-preserving, but a definite statement cannot be made at this time.
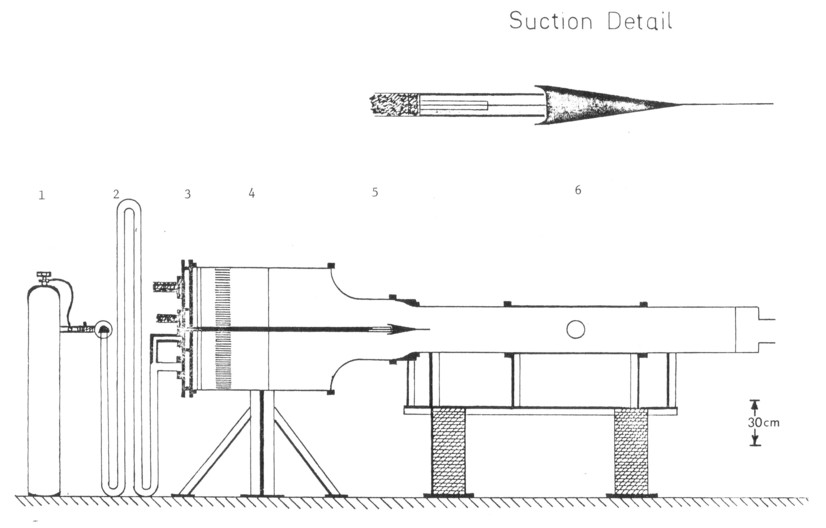
Figure 1. PLANE TURBULENT FREE SHEAR LAYER BLOWDOWN FACILITY 1) High pressure manifold, 2) Mixing pipes, 3) Flow distribution manifold, 4) Flow settling chamber, 5) Contraction, 6) Test section.
The exhaust conditions and the time development of the flow are apparently not significant. The flow is effectively terminated by high -pressure drop screens three tunnel diameters downstream from the inspection station. Changing these screens (different on top & bottom) had no effect on the flow at the inspection station, showing that its influence does not extend that far upstream.
The development of the flow in the blowdown tunnel is such that all measurable quantities have clearly reached their steady state values (see Figure 11). Free stream velocities measured with a hot wire at the inspection station are steady state at the time the flow is photographed. Furthermore, the shear layer has had 10 flow times from the splitter plate to the inspection station to develop with the free streams at their steady state velocities.
CHAPTER III
The Visualization Technique
3.1 Flow Visualization Methods
The approach taken here is to examine the turbulent structures within a shear layer. There are many ways to get information about these structures, but all seek to understand the topology and dynamics that describe them.
The biggest problem with any technique for analyzing structures is that the information recorded is never obviously tied to a structure. This fact is the reason that the structural approach has been so slow to develop experimentally.
The methods in use at present for deducing structures are:
1) point velocity measurement (hot wire, laser doppler velocimetry)
2) point scalar measurement (temperature, species probes)
3) fluid tracers
4) schlieren photographs
5) shadowgraphs
6) holography
There are various problems with these techniques, some of which are Inherent in the methods, and some inherent in the turbulent structures themselves.
The most obvious problem with 1) or 2) is the necessity of inferring a three dimensional structure from a point measurement. This limitation has been only partially overcome by correlating velocities at various 24 points to deduce the existence of large eddies [9].
Shadowgraphs and Schlieren photographs map the density fluctuations of turbulence. However, these measurements are very difficult to unravel because they measure derivatives (second and first respectively) of the density fluctuations, and they integrate the fluctuations over the path of the light to the film.
Tracers and holography represent the best methods, because they can identify the spatial location of the fluid elements. However, these too suffer from the fundamental problem inherent in the attempt to identify turbulent structures; there is as yet no way to mark the turbulent structures themselves. Only the effects of these structures can be seen. The structures develop within the layer and must somehow be marked afterward. Holographic records ideally contain all the necessary information, but the stochastic three dimensionality of the process makes deductions from these records akin to deciphering the Rosetta stone.
The manipulation of a phosphorescing gas for visualizing the flow is a technique developed by the author (with initial aid from Dr. D. B. Stickler, AVCO Everett) to get around these problems to some extent. Direct photo-excitation, collisional excitation, or collisional de-excitation of the phosphorescing gas allows identification of the emission with the presence, absence, and degree of molecular scale mixing of the gas. The diagnostic gives information about the uniquely turbulent process of mixing consisting of a rate limiting "eddy" mixing - intermingling of intact fluid elements - together with their final dissipation through the action of viscosity.
Turbulence is a momentum transport phenomenon. The structures involved in the turbulent flow should account for this transport by their topology and dynamics. The most conspicuous characteristic of this transport is the coupled macroscopic and microscopic transfer that has the effect on scalar transport described above. Thus the turbulent structures identified by a diagnostic separating "eddy" and molecular scale species mixing should be closely related to the momentum transport structures fundamental to turbulence.
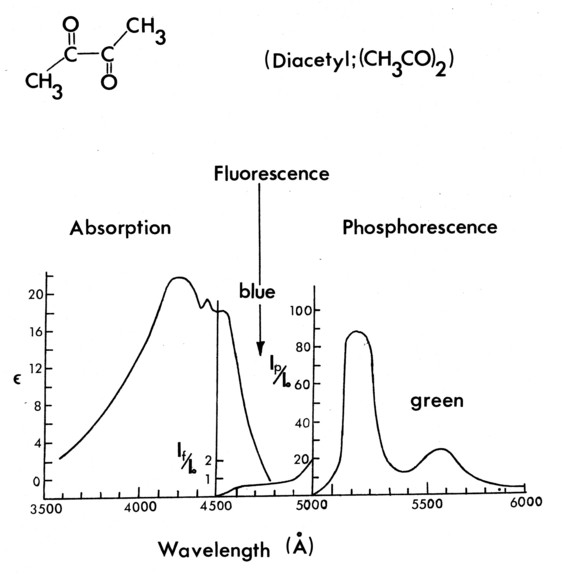
Figure 3a. Absorption and emission properties of Butanedione.
The problem of marking a particular structure rather than examining the state of mixing at a particular time still remains. However, all structures that represent the beginnings of mixing are marked and clearly identifiable, such as intact eddies from one stream or the other. These structures can be resolved in time and space without obscuring effects of the intervening fluid, and they are directly measurable. Furthermore, the collisional excitation technique makes possible identification of the microscopic transport resulting from these structures. These facets of the technique are explained below.
3.2 The Physics of the Phosphorescing Gas Technique
The visualization method that is used here to diagnose turbulent mixing can be understood most easily by considering the physics of the luminescing gases that make it possible.
The visualization technique revolves around the use of 2, 3 Butanedione, an organic chemical. Its molecular energy state properties are given in Figures 3a-c [10],[11]. The essence of the technique is the transfer of optically induced molecular energy from one species to another by physical collision. These same collisions are always coincident with molecular scale mixing between the species.
In each of the technique variations, Butanedione is the gas whose emission is recorded, but it can be excited directly by blue light, excited collisionally by Benzene [12], or it can be de-excited collisionally (quenched) by oxygen [13] after being directly excited by the light beam. Benzene is excited by 2400-2600Ǻ ultraviolet light, and fluoresces at ≈ 2900 Å; neither radiation is absorbed by Butanedione [12]. Oxygen neither absorbs nor emits radiation in the UV, blue or green; it only quenches the emitting energy of the Butanedione.
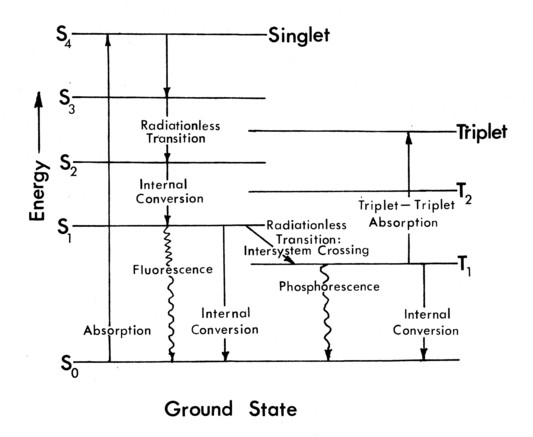
Figure 3b. Internal structure of Butanedione.
There are thus three processes involved. They are illustrated schematically in Figures 4a-c.
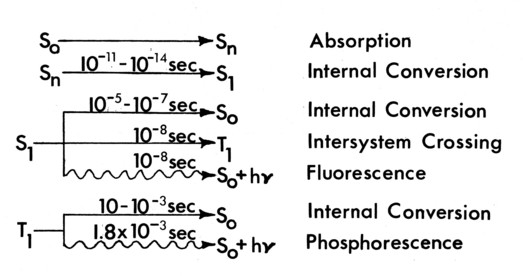
Figure 3c. Excited state lifetimes of Butanedione.
The first diagnostic variation (Figure a) uses Butanedione as a simple tracer gas. By mixing it uniformly into the energetically inert bulk gas Argon in one stream, the emission throughout the mixing layer is directly proportional to the concentration of the Butanedione, for low beam absorption. By filtering out all but the blue light (3800Ǻ - 4800Ǻ) entering the gas to excite the Butanedione, and filtering out all but the green light (5000-5800Ǻ) coming out, a very high signal (emission) to noise (input beam) ratio can be obtained.
The physical context of the light beam and filtering is shown in Figure 5. Since the beam plane is normal to the direction of view, the filtering and beam masking is simple.
The paths of the absorbed radiant energy inside the Butanedione molecule are shown in Figure 3b.* The recorded process is the phosphorescent emission from the excited triplet state. Note that phosphorescence indicates emission from an excited triplet state, while fluorescence is emission from an excited singlet state. In the case of collisional excitation or quenching, this triplet state is either excited directly by molecular energy transfer during a collision, or it is de-excited by transferring its energy to another molecule before it can emit. [14]
Collisional excitation of Butanedione by Benzene is shown schematically in Figure 4b. Here, the ultraviolet radiation is only absorbed by the Benzene. Following the energy transfer processes, the output-green filter passes light only from regions that have undergone molecular collisions, i.e. are molecularly mixed. This variation of the diagnostic depends on the occurrence of the physical process (molecular mixing) that is being investigated for a signal to be recorded, and is thus an indicator of the process.
Just as collision4excitation is a diagnostic of molecular mixing, quenching of Butanedione (Figure 4c) is a diagnostic of its absence. Quenching of the Butanedione by Benzene prevents the green phosphorescence in molecularly mixed regions in exactly the same way that the Benzene stimulates it.
3.3. Phosphorescent Visualization of a Shear Layer
The two mixing diagnostics described above, complemented by Butanedione used as a simple tracer, are used in the manner illustrated in Figure 6 to give direct photographic records of a cross-section of the concentration structure within a shear layer. The mixing layer and the exciting light beam are shown schematically for the case of the phosphorescent gas alone mixed into the lower stream. The emitted phosphorescence is seen as shading within the boundaries of the light beam.
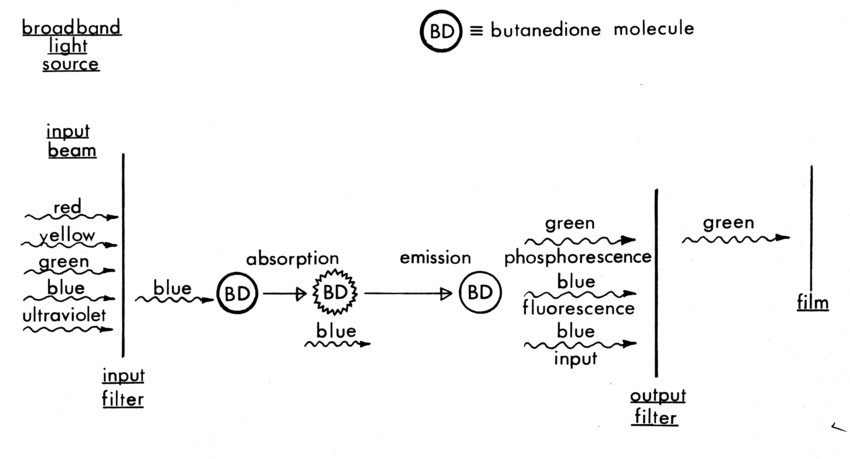
Figure 4a. Direct excitation of Butanedione.
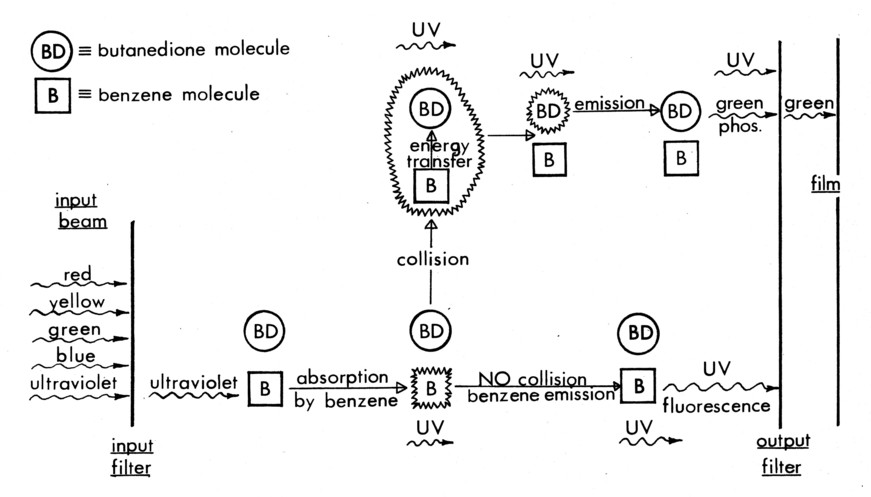
Figure 4b. Collisional excitation of Butanedione.
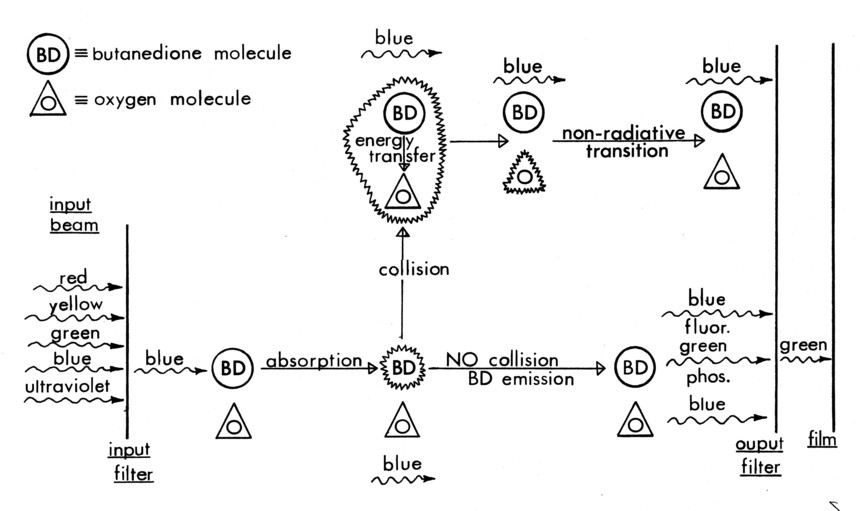
Figure 4c. Quenching of Butanedione
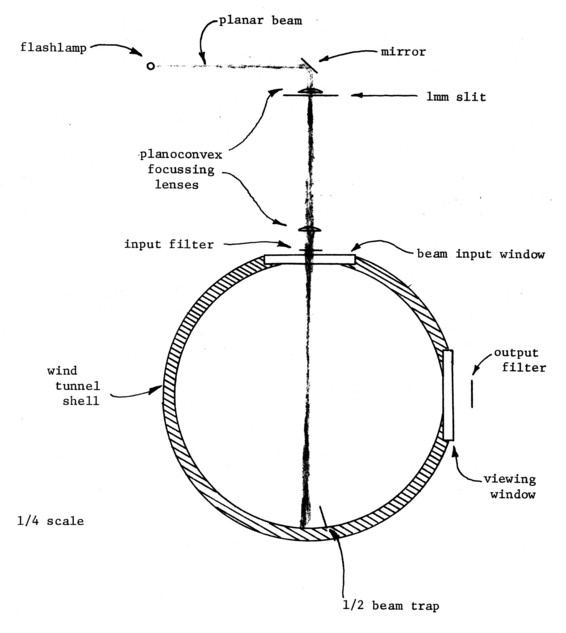
Figure 5. Light handling geometry.
The light beam is planar with a width 1-2mm in this experiment. This is designed to be on the order of the smallest turbulence scale, so that the concentration of the phosphorescing gas does not vary significantly normal to the beam plane. This smallest turbulence scale is assumed to be the Kolmogorov length scale, ℓk ≈ l mm for 6m/sec and 7 m/sec stream speeds. For this reason, and because there is no emission from the surrounding fluid, nor absorption by it, the emission from within the light beam forms a true cross-sectional map of the emitting gas throughout the shear layer, again for the case shown in Figure 6.
Furthermore, phosphorescing gas absorbs according to Beer's law:
I/ Io = e-εa dC (6)
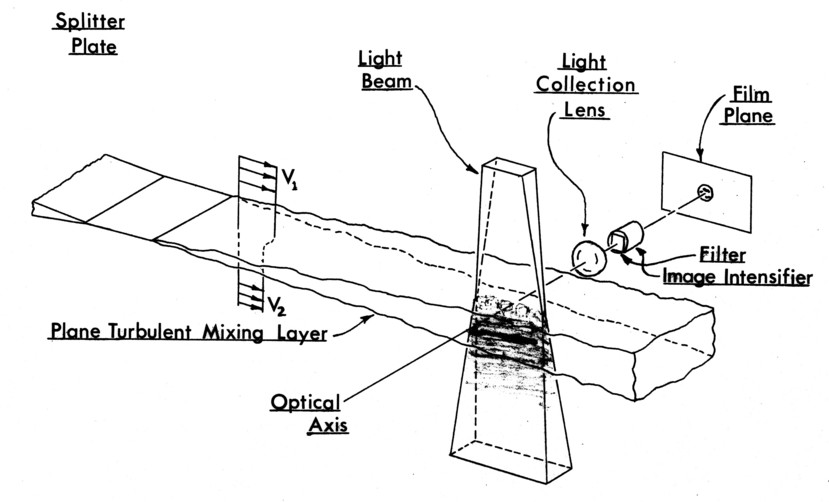
Figure 6. Geometry of the flow visualization.
where I = intensity, Io = original intensity, ε a = extinction coefficient, d = distance traveled, and C = concentration, so that for low enough concentrations,
1-I/Io=εa dC
Since the emission is related directly to the absorption by the radiative quantum efficiency, Q,
I emitted ≈ Q εa dCIo
The emission then directly measures the cross-sectional map of the concentration within the mixing layer.
In the same manner, with Butanedione seeded uniformly in one free stream and Benzene or oxygen uniformly seeded in the other free stream, the phosphorescent emission from the mixing layer gives a cross-sectional map of the areas that are mixed or not mixed, respectively, on a molecular scale. The "unmixed" areas within the layer represent the macroscopic but not microscopic intermingling of fluid elements that is the rate controlling process of turbulent mixing.
The two collisional variations act in similar ways to give Butanedione emission proportional to the concentration of only one component. This behavior is a peculiarity of the experimental conditions, and is derived in Appendix I. The essential reasoning is that there are so few excited molecules that the collisional transfer process is more efficient than the absorption process. In the case of collisional excitation, this means that for the normal conditions of similar concentrations of Benzene and Butanedione molecules in each free stream, only 1% of that Butanedione concentration is needed in any mixture of the two, for total transfer of the excited energy. Thus emission will come from any molecularly mixed region containing a Butanedione concentration greater than a certain threshold, and these regions will emit proportional to the Benzene concentration. Below this threshold, emission drops off rapidly because each molecule of Butanedione, once excited, has a long lifetime and remains excited, reducing the number of remaining receptor molecules.
In the case of quenching, the oxygen concentration is so large that effectively all molecularly mixed regions do not emit.
The emission from each of these three variations is recorded photographically. The exciting light source is of high energy and short duration, so that with small enough exposure times the picture is effectively an instantaneous record of the concentration map at that time. Due to the low repetition rate of the apparatus, the exposures must be too far apart to see development of the structures. Thus no velocity information is obtained.
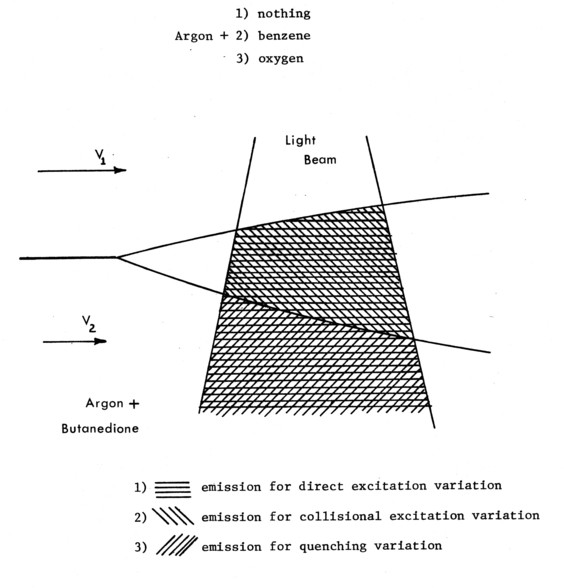
Figure 7. Illustration of phosphorescing gas visualization variation.
Summarizing, three diagnostics for recording cross-sectional concentration structures make up the phosphorescing gas visualization technique applied here to a turbulent shear layer. Figure 7 serves as a final conceptual guide to these variations, superimposing the results that would be obtained by applying the variations to a laminar shear layer. Any example using a turbulent flow would be prejudicial.
3.4. An Engineering Analysis of the Technique
The practicality of the phosphorescing gas visualization technique is rooted in the properties of 2,3 Butanedione. The yellow, highly odorous, non-toxic chemical has been studied for over three decades by photochemists, but its usefulness as a tool in flow visualization was first realized by A. Epstein [15], who used its fluorescence to study transonic flow in a compressor [16].
Butanedione is almost unique among chemicals due to its combination of desirable properties for flow visualization. It is easy and safe to handle (if smelly), it has a high vapor pressure at room temperature (≈ 40 mm), and its absorption and emission bands can be handled conveniently. For other chemicals, the high vapor pressure required for seeding in a gas are coupled with absorption and emission in the ultraviolet, a region difficult to record (Benzene for instance). The green phosphorescence is ideal for practical purposes, since the majority of recording devices are most sensitive in this region, as is the eye.
The difficulties involved in using Butanedione as described above to visualize turbulent mixing structures, arise from the constraints required to achieve a simple record of these structures. The most costly specifications are three: a planar beam, low absorption, and short exposure. A planar beam gives a cross-sectional map of the structures, but making such a beam, forces the acceptance of high collimation losses. The short exposure implies a high power light source and losses due to the long lifetime of the phosphorescence.
The optical system is designed such that the motion of a 10m/sec flow during excitation and exposure is on the scale of the smallest fluid element - 1 mm. This is also the resolution limit placed on the emission by the beam thickness. The light losses caused partially by the above constraints force the use of an image intensifier (Figure 6) to amplify the phosphorescence to a level where it can be recorded by fast film.
Figure 8 illustrates all of the manipulations by which the energy used to excite the gas is transformed into a signal recorded on film. The gains and losses of each of these processes are given in Figure 9, resulting in enough light to adequately expose high-speed film. The collisional excitation variation is taken as the numerical example because it is the worst case. Tailoring the input beam to the ultraviolet absorption band of Benzene causes the additional inefficiency. The Benzene has the additional incidental difficulty that it is a toxic chemical with a cumulative effect.
A flashlamp is the natural candidate for a light source. It supplies light in both the Butanedione absorption band and the Benzene absorption band, and is most efficient in the ultraviolet region needed for the least efficient Benzene absorption. Changing from one to another of the diagnostic variations implies only changing the input light filter and the seed chemicals added.
Most of the numbers given in Figure 9 are optimizations, given the constraints of the experiment and current technology. However, the quantum efficiency of the phosphorescence is an experimentally measured constant.
For directly excited Butanedione, the quantum efficiency (quanta emitted/quanta absorbed) is 0.15, [17] quite high. Perhaps more surprising is that the quantum efficiency for the collisional excitation process
(quanta absorbed by BENZENE)/(quanta emitted by BUTANEDIONE) is 0.12. This is due to the very long lifetime of the excited triplet state in Benzene. This long lifetime makes possible the use of the collisional excitation process on the 100 ps time scales needed for the stop action pictures. For the vapor pressures of approximately l mm used, the collision frequency is 107 per second, allowing the energy transfer to occur completely in the beginning of the 100-500 ps exposure time.
Unfortunately this long phosphorescence lifetime limits the technique to low speed flow, and the flashlamp repetition rate limits the data rate to one photograph per few minutes. This latter rate translates into one picture per 5 second blowdown run.
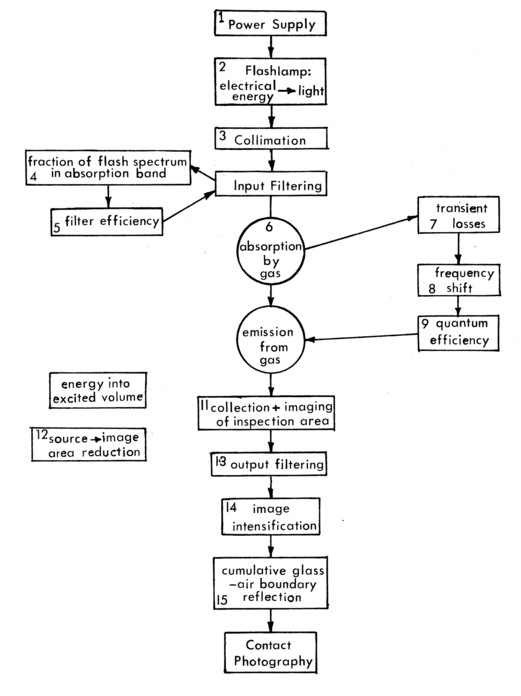
Figure 8. Energy loss flow diagram.
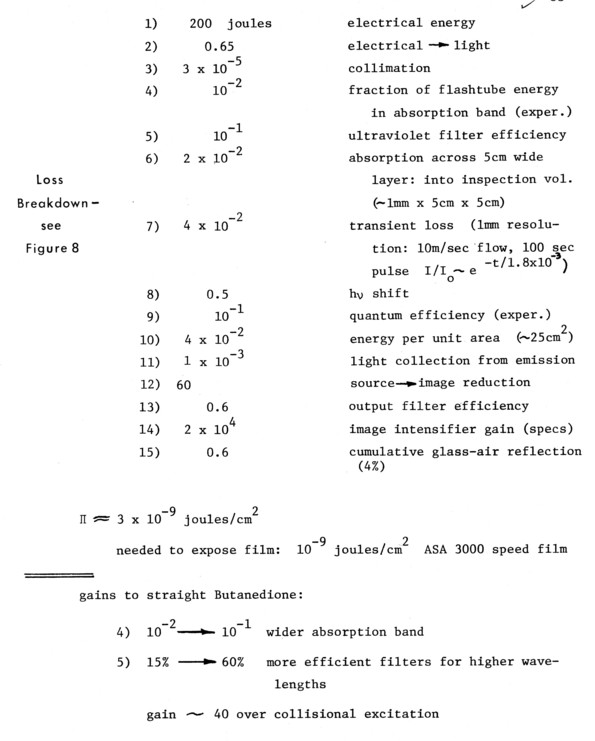
Figure 9. Energy losses - Collisional Excitation
3.5. An Assessment of the Technique
An overall evaluation of the phosphorescing gas visualization technique is given in Figure 10. For the examination of turbulent structures, the ability to separate "eddy" and molecular mixing far outweighs all of the inherent disadvantages. Eddy mixing here refers to fluid that is mixed on the basis of a macroscopic average, while microscopic averages within that average reveal unmixed species.
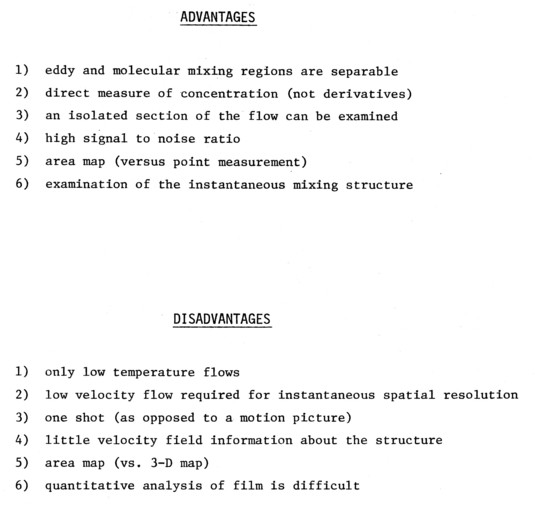
Figure 10. Phosphorescent gas visualization technique assessment.
Of the advantages, only the first two given in Figure 10 are totally coupled to the physics of the interacting gases. The rest result from the geometry of the incident beam, excited gas, and recorded image. As a whole the technique offers two valuable characteristics: separable mixing structures, and a direct, unambiguous measurement of one facet of these structures - a cross-sectional map of their spatial geometry.
On the negative side, again only the first two result from the properties of the phosphorescent gas. Butanedione decomposes at high temperate lure so that it cannot be used as combustion diagnostic. Also, because of the slow time response of the phosphorescence, the Butanedione cannot be excited to high enough levels over high flow speed time scales to be measurable.
Disadvantages 3) - 5) in Figure 10 represent the difficulties in interpreting the information that is recorded in a photograph using one of the phosphorescing gas variations. Although an area map of the mixing structure is far superior to a point measurement, the structure itself is highly three-dimensional, and deducing the true topology of the structure from the area map is hazardous at best. This task is made more difficult still because each picture gives no information about the evolution of the flow, only the state at one particular instant. Because of the low repetition rate, all pictures are disjoint cases from a random flow, giving no velocity information, only spatial structure. The only way to determine predominant structures is by statistical analysis of a group of pictures.
One added limitation is the complexity involved in getting quantitative data from information recorded on film. The problem is as much with the infancy of the science as with the basic processes involved, at this-time. No attempt to do this has been made in the present work.
CHAPTER IV
The Apparatus
4.1 General Description
Visualizatcion of turbulent structures in a plane shear layer has been done in the Argon blowdown facility drawn to scale in Figure 1. The experiment is almost entirely automated, designed for a large number of repeatable short duration runs. Sufficient measurements are recorded to specify the flow during each run.
The use of Butanedione as a visualization tool requires that even small concentrations of oxygen be excluded from the flow circuit to prevent quenching of its phosphorescence. With Argon as the resultant bulk gas, cost considerations dictate a blowdown configuration. Exclusion of air adds considerable complexity to the operation of the entire facility. Other practical considerations led to seeding the organic chemicals into the bulk flow during each run.
The experiment is labor intensive and low cost. This translates into great care to details and simple construction. The apparatus can be broken down functionally into the flow system, the seeding system, instrumentation, the control system, and the optical system.
4.2. The Flow System*
Mass flow for the blowdown is supplied by a manifold of twelve standard Argon cylinders. These supply the driving pressure for a pair of changeable sonic orifices that meter the flow rate at the desired value.
* See Figure 1
Each orifice supplies one free stream, and the two flows are separated by gas tight seals at all points in the flow between these orifices and the end of the splatter plate.
Following the sonic orifices are long pipes (#2, Figure 1) that mix the seeded chemicals uniformly into the bulk flow. The 5 cm diameter pipes have a physical length to diameter (L/D) ratio of 100, and a fluid mechanical L/D of perhaps double that due to two 90° bends and three 180° bends in the pipes.
These pipes in turn feed a high pressure flow distribution manifold (#3, Figure 1). Together, the pipes and manifold determine the time required for the overall flow rates to reach steady state, because of the mass needed to fill that volume at high pressure (6 atm.). The 2.5cm wide manifold is divided into four parts because the facility is designed to produce both annular and plane shear layers. Thus there are inner and outer sections of each half of the manifold, connected only by the pipes as shown in Figure 1. The diameter of the pipes to the inner sections of each half are tailored so that the total flow times from the point where the flows split to the manifold orifices are the same for the inner and outer sections of each half. The tailoring is done to equalize the concentration response times of the inner and outer section of each half.
The manifold has a negligible pressure drop from the pipe inlets to the 61 sonic orifices distributed uniformly over each half of the base area of the 80cm diameter flow settling tank. This 90 cm long settling tank provides free streams of uniform velocity for the shear layer. There are two screens immediately downstream of the flow distribution orifice plate to break up the sonic jets, followed by honeycomb (L/D = 10) and another screen (#4, Figure 1), to decrease the levels of the longitudinal and transverse turbulence caused by the jets.
Two consecutive contractions (9 to 1 total) to the 30 cm diameter test section accelerate the flow to the desired speeds. Between the contractions, suction slots remove the boundary layers that have developed on the splatter plate that divides the settling chamber into two halves.
Suction flow is driven into the manifold shown in the detail in Figure 1 by the internal pressure of the tunnel. Contraction of the flow through a thin slit followed by expansion into the manifold built into the splatter plate gives a uniform pressure drop across the width of the splatter plate and uniform suction. The suction mass flow rate is adjusted by setting the area of side openings from the suction manifold. The suction flow rates will adjust themselves so that the total pressure drop across the slit and side openings is the tunnel pressure (above one atmosphere). The correct suction flow rates are found experimentally by nulling the static pressure difference between a tap on the outside of the suction cusp and the free stream static pressure. The suction manifold is divided and sealed into upper and lower sections with exhausts on both sides of the splatter plate. These fixed area exhaust parts are sealed between runs by rubber pads that are pulled out of the way during a run by pressure operated cylinders, in turn driven by the pressure in the flow distribution manifold.
Following the boundary layer removal, the splatter plate sides converge symmetrically to a thin edge. The turning flow in the region of the splatter plate is then straightened by an 0.8 mm thick plate 10 cm long. The boundary layers grow again over the 25 cm length from the suction cusp in the tip of the flat plate.
From the splatter plate tip the mixing layer develops to the point 96 cm downstream where it is examined by the visualization technique. The flow is terminated by a misstated screen 100 cm downstream of the inspection point, or about 3 tunnel diameters. It extends over the entire tunnel diameter, totally masking the contraction effects of the final 15 cm exhaust diameter. The screen accounts for the above-atmospheric tunnel pressure. A cloth is added to half the misstated screen to equalize the pressure drops for the different flow rates. Removing the added screen had no apparent effect on the shear layer.
Finally, the flow exhausts through a door controlled by a pressure operated switch to remain open when the flow rates result in a normal operating tunnel pressure. Otherwise it closes to keep air from contaminating the flow.
4.3. The Seeding System
The seed chemical flow for visualization is introduced as a vapor into the bulk flow during a blowdown test, immediately downstream of the metering sonic orifices. The chemicals are kept in a high pressure Argon reservoir as a liquid in equilibrium with its vapor. The total flow rate from this reservoir is also metered by a sonic orifice, but the flow rate of the seed vapor itself depends only on the partial pressure of the vapor in the reservoir.
The required seed mass flow rates are achieved by heating the reservoir, increasing the seed partial pressure. Thus the amount of argon flow needed to propel the vapor into the high pressure mixing pipes is decreased to an amount that is 10-20% of the bulk flow for each stream.
For initial runs where there is no seed vapor in the flow-settling chamber, a low speed trickle flow is run through the appropriate flow branch to fill the chamber with the proper vapor concentration. This is necessary because the flow rates are such that the total volume of the flow during a blowdown run is only a few times the settling chamber volume; the seed concentration will not rise from zero to an equilibrium value during one run for normal flow rates. Fortunately, the mixing of the flow distribution jets smoothes out all of the rapid fluctuations of the seed concentration. These are most often caused by slight mismatches between -the bulk flow rate and the seed flow rate during the transition to steady state at the beginning of each run and the flow turn off after each picture.
In cases where only one flow is seeded, a false seed bottle of Argon is used for the other stream to keep the overall flow rates the same for the different variations of the visualization technique.
4.4. Instrumentation
Initial and final conditions of the flow supply reservoirs, are measured by gauges giving the pressures in the main cylinder manifold, the trickle reservoirs for preseeding, and the main seed reservoirs. The temperatures of the seed reservoirs and the lines to the injection ports are measured on a panel meter, using thermistors as sensors. Thermometers are used in addition to check the calibration periodically.
During each run the metering sonic orifice stagnation pressure, the flow distribution manifold pressures (for each half), and the tunnel pressure, are measured by strain gauge transducers, and read out on a chart recorder. Suction static pressures are also measured as described above (4.2) and similarly recorded.
The flow is measured in a conventional sense by a DISA Type 55 D01 constant temperature hot wire anemometer. Velocity measurements were made by traversing a hot wire vertically at low speed near the splatter plate and at higher speeds at the mixing layer inspection station. Position and hot wire signals were amplified and recorded on an oscillograph. The signal handling and recording system had negligible drift, and a 100% frequency response at 2 kilohertz. Hot wire calibration was performed in a miniature Argon steady state wind tunnel, and the calibration was verified by cross-checking with flow rates calculated from the pressure driving the metering sonic orifices. Traverser position readouts were calibrated and double checked for repeatability.
4.5. The Control System
All flows are controlled by solenoid valves: the seed flows directly, and the main cylinder manifold by a pressure driven ball valve. The main cylinder manifold valve solenoid is in turn operated through relays by a small integrated circuit timing console. Main seed solenoids are operated by a switch on the main manifold valve. This switch is set to turn on the fast acting (O.1sec) seed solenoids when the slower (0.8sec) main manifold valve is partially open. The delay is adjusted so that a mixture of the two flows over the opening time of the main valve will give the same seed concentration as that during steady state operation. This averaging is done in the flow settling chamber.
The timing console controls the sequencing of the entire experiment, except the preseeding flow, which is operated as a separate sequence using mechanical time delay relays. Sequencing is as follows:
A RUN switch initiates the blowdown run, turning on the main manifold valve. Full opening of the valve initiates a delay (D1) to allow the flow to reach equilibrium. Then the flashlamp is remotely triggered. The flash pulse in turn begins a delay (D2) before the beginning of the exposure of the film. This exposure (D3) is performed remotely by gating the image intensifier on with a pulse from the timing console. At the end of the exposure, there is another short delay (D4) before the main manifold valve is automatically turned off. Returning the RUN switch to RESET readies the sequence for the next operation. Delays D1 to D4 are easily adjusted by potentiometers over a factor of 10 in time.
Suction and main flow exhaust ports are opened during a run as described in section 4.1. The tunnel exhaust door is a butterfly valve driven by a gas actuated cylinder whose gas supply is solenoid controlled by the tunnel pressure switch.
4.6 The Optical System
The source of the radiant energy for the gas excitation is a 200 joule capacitive flashlamp pulser. It produces nominally a 100μs inductor-tailored constant current discharge through the flashlamp after preionizing the gas with high voltage on an exterior trigger wire. The outset requires a 1-2 minute recharge time.
Figure 5 shows the input beam optics. Through a collimating lens a 3 mm bore, 75 mm long Xenon flashlamp illuminates a 1 mm slit that acts as a spatial filter. The lamp is at the focus of the lens, so that the light passing through the slit is approximately parallel. This light is then imaged at the center of the tunnel, giving a beam of about 10 milliradian divergence, varying between 1 and 2 mm in thickness 7 cm vertically on either side of the tunnel centerline (14 cm total). A beam trap shields the viewing window from the beam reflection off the flat black tunnel bottom. The shield is aligned parallel to the tunnel axis, so that its flow disturbance is negligible.
All optics are cylindrical with special mounts constructed to allow adjustment of the various components. These mounts are secured to an optical rail not attached to the tunnel. All components of the optical chain are 75 mm long and bounded by mirrors running the length of the chain up to the input window. These mirrors decrease the beam divergence in the beam plane up to the window. The beam then expands in this plane so that at the tunnel centerline it has a constant intensity over about 125 cm (62 cm from view center), while upstream and downstream of this range its intensity falls off rapidly.
All of the input optics, including the input window, are made of UV grade quartz for high transmission at the 2500Å excitation wavelength of Benzene. The flashlamp envelope is so thin that although it is made of standard fused silica, the absorption at 2500Å is negligible. Mirrors are coated for extended reflectance in the UV.
The optical train is aligned so that the beam plane is precisely parallel to the viewing window, at the geometric center of the tunnel.
A specially made camera looks through the viewing window at the emission with a f 1.2 55 mm Nikon lens. This lens focuses the flow scene on the image intensifier face, which gives a preset luminous gain of 20,000 to expose the film pressed against its output face to record the image.
The image intensifier is a ITT Type F4747 microchannel wafer tube. It is physically small (4.3 cm diameter, 3.0 cm long), with an 18 mm useful image diameter. The standard model is designed for night vision binoculars at a cost of $1,700 per tube. An advantage of this type of tube is that it can be gated by a relatively low voltage (200 V). The gating turns off the tube with a time response better than lose so that the tube functions as a convenient, very fast shutter. Internally, the tube is proximity focussed, with a fiber optic inverter on the output. An additional fiberoptic extender is added to permit contact photography, since normally the output face is at high voltage. The output image has a resolution of 25-28 line pairs per mm. While the tube has negligible distortion, it does have a gain variation of 3 to 1, causing the image to be brightest at the center of the tube, falling off radially toward the edges.
Gating the tube off except during the exposure reduces the steady state tube noise (1/10 of that without gating) to a level that will not expose ASA 3000 speed film over the duration of a blowdown run. A 2.7 volt battery supplies power to the tube, while a 225 volt battery supplies the gating voltage. The gating pulse, controlled from the IC blowdown sequencer, is good to lose As described above the gated image intensifier cost $4,000 and had a three month delivery time, making it effectively the single irreplaceable piece of the apparatus. It has been found to be durable and totally reliable.
The lens and image intensifier as a unit are mounted on an optical rail, together with the filmback, which moves up and back against the image intensifier to accommodate film loading. Focussing the camera is done by moving the camera on the rail and changing lens extensions so that the variable focussing range on the lens can give the proper magnification on the intensifier input face. The focus is tested by lining up a high-resolution target with the light beam and adjusting the lens for the best image on the intensifier output face. This image is recorded by contact photography for future comparisons.
Between the lens and image intensifier are placed a green filter passing the phosphorescent emission, and a neutral density filter. The neutral density filter is easily changed in an inserted filterholder. Together with the exposure time, the neutral density filter controls the light energy falling on the film so that it is properly exposed.
The 10 cm viewing window limits the scene size to about 15 cm diameter. By changing the camera setup the scene size can be varied down to 3.6 cm. Resolution of the entire image recording system is apparently limited by the image intensifier.
The scene position in the tunnel as recorded on the film is calibrated by measuring the position of the tunnel centerline in relation to the image intensifier output face circle and a dot inside the circle. The dot is a phosphor clump, and together with the circle, it provides a geometric reference fixed with respect to the tunnel centerline.
CHAPTER V
Blowdown Visualization Facility Operation
5.1 A Blowdown Run
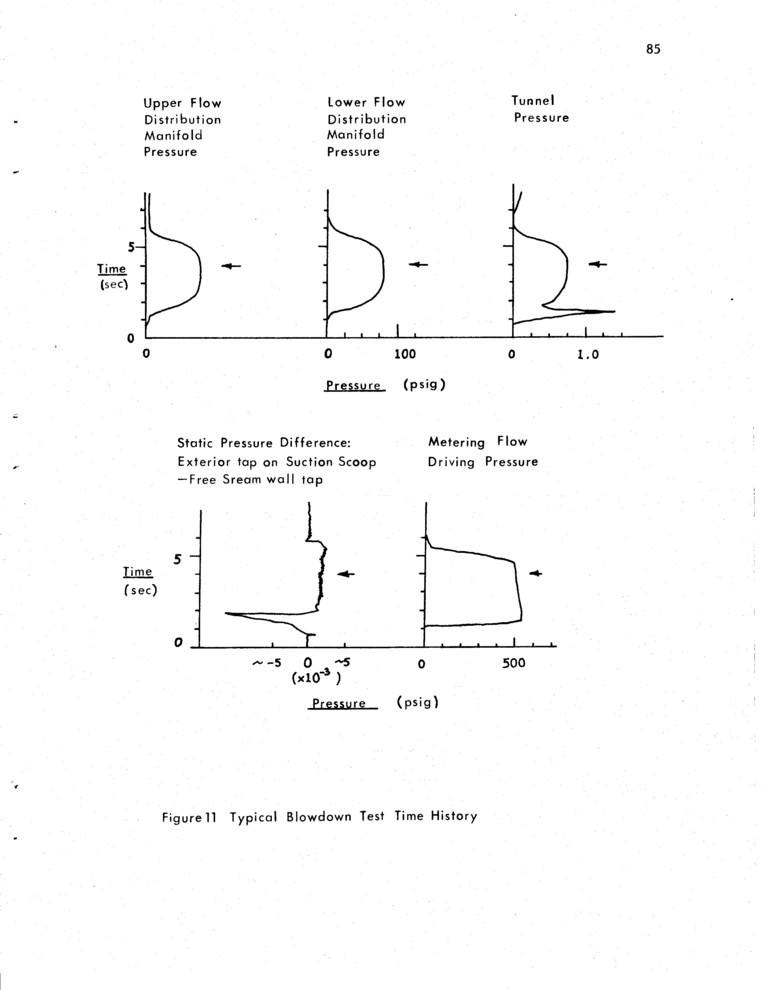
A typical blowdown time history is shown in Figure 11. These data are recorded for each run, together with diagnostics to tell whether the suction and main flow exhaust doors operate properly. For this run D1 = 3.0 sec, D4 = 0.25 sec. The photo is taken after the flow has reach ad steady state. Equilibrium is best measured by the tunnel pressure, which is proportional to the flow rate to the 2.1 power. The initial spike in the tunnel pressure is caused by the pressure buildup needed to actuate the main exhaust door.
A total mass flow rate of approximately l Kg/sec through main metering sonic orifices of diameter 0.72 cm and 0.64 cm result in the rise time of about Parsec seen in the flow distribution manifold pressure traces. This flow, together with the seed flow give the 6 and 7 m/sec stream velocities that are the nominal conditions of all of the visualization pictures. The main Argon manifold is refilled from a thirteenth bottle after each run to give the same approximate flow rates for each run. During a run the steady state flow rates are constant to within 5% or less.Suction flow is adjusted to be correct at a flow velocity of 10 m/sec, so that in most cases suction flow is more than needed. However this suction flow, as a fraction of the free stream flow rate, varies by less than 1% from 5 m/sec to 10 m/sec flow rates. Also, measurements indicated that the initial momentum thickness was only affected by inadequate suction.
The seed flow rates decrease 10% over an entire run, as does the Argon flow. However, between runs the vapor re-equilibrates, so that the initial vapor flow rate is constant for each run. The Argon flow rate decreases 8-10% for each of the runs, until the reservoir is refilled. Even so, since this flow is typically 15% of the main flow, the 40% seed flow change amounts to 4-5% of the main flow, which is compensated for over a series of runs. Furthermore the flow rates change by the same fraction in each stream so that the ratio of free stream velocity difference to free stream velocity remains unchanged even though the velocities vary by up to 30% of the velocity difference itself. This means that the mixing layer spreading rates and other properties remain the same from run to run, as indicated by the data. Typical pressures in the seed reservoir vary from 460 psig to 300 psig over a series of 5 runs. Trickle flow is used as required before a series of runs. Nominal seed partial pressures are on the order of l mm partial pressure in the seeded stream for both Butanedione and Benzene.
The flash fires and film is exposed, at a predetermined point in the run. Each run is controlled automatically, requiring only reservoir pressure and temperature gauge recording, manifold refilling, flashlamp outset charging, and film reloading between runs. A typical series of 5 nominal runs takes 5 minutes per run. Sequence timing can be changed by setting the controller, without adding to the setup time. Conditions for each run are recorded on a data sheet, to which the time history and photograph are later attached.
5.2 Setup
The nominal operating schedule of the facility is determined by the replenishment and equilibration of the gas supplies. Normally a series of 4-5 runs is made, then the seed reservoirs are refilled and a full thirteenth Argon cylinder is added to the main manifold. Then a two-hour equilibration period is allowed before the next series of runs.
Instrumentation and control electronics are turned on before each series of runs and off afterward. Seed reservoirs and lines to the mixing pipes are brought to an equilibrium temperature by controlling electrical heating tapes. typical reservoir temperatures are 60-70°C for the above nominal flow rates. When needed the liquid chemicals are injected into the reservoir under Argon pressure.
The metering orifices for the main flow can be removed and replaced to get different stream velocity ratios.
CHAPTER VI
Additional Experimental Techniques
To avoid quenching of the Butanedione phosphorescence the stream seeded with the Butanedione must have an oxygen concentration of about 0.01 mm Hg or less. In practice, the entire tunnel is evacuated to 0.2 mm He with a 0.1mm/minute leak rate, then filled to above 1 atm. in 15-20 sec. After this the extremities of the apparatus are purged. The estimation of 0.01 mm He results from the analysis of collisional excitation (Appendix I) which must apply in both cases.
After filling the apparatus with Argon, the tunnel is kept at a pressure of about 5mm of water at all times between runs by a continuous flow of Argon. This pressurization flow is increased during a run to compensate for poor sealing of the opening and closing ports. Since Argon is heavier than air, any vertical Argon-air interface is unstable.
Variations of the technique are done in sequence. The common bulk mass flow origin, and the possibility of back flow ground the splatter plate create the possibility of the contamination of one stream by the other. For the direct excitation (variation 1), small amounts of contamination are acceptable, since a low concentration of Butanedione in the wrong free stream will not emit measurably. However, small concentrations of Butanedione in the Benzene stream will cause apparent noise around the mixing layer (variation 2). This problem was avoided by delaying the seed flow until the metering flow is sonic, and waiting long enough to wash any back flow downstream. The problem is more severe for the quenching variation, but the above solution was found effective, together with a high pressurization flow into the mixing pipes of the Butanedione seeded flow to overrule molecular diffusion of the oxygen.
CHAPTER VII
Data Description
7.1 Data Format
Pictures of the flow are taken on 100 x 125 mm sheet film, and have a circular view. The image is limited in area by the 18 mm diameter image intensifier output face. Large images reproduced in Appendix II are blowups of that format.
7.2 Spurious Effects
Various artifacts are introduced into the data, principally by the image intensifier and the film. The most obvious are due to a non-uniform gain distribution of the intensifier tube, which causes the image of a uniform source to be brighter at the center than at the outside. This distribution is shown in Figure 12, an exposure taken with a uniform mixture in the test chamber. The small dark cone at 11:00 in the photo is a shadow of an object in the tunnel, and not due to the gain distribution. The brighter crescent seen across the top of the tube is rarely seen in the data because the emitting Butanedione is always seeded into the lower stream; the top (upper free stream) is dark except for the presence of noise. Finally, in the upper right center of the image is a bright spot. This is a phosphor clump on the fluorescent screen, essentially an amplified point noise source. Effects introduced by the film are distortions in the light variation. Polaroid Type 57 film was used for the data reproduced in Appendix II because of its high speed and convenience in taking many pictures. Type 57 is an ASA 3000 speed film of medium contrast. Its properties are given in Figure 13.
The characteristic curve indicates that the recorded light variations are expanded, and recorded with a dynamic range of about 30. In other words, the response of the film to light indicates that two areas that emit with intensities I1 and I2 will be recorded on the film with densities of I11..3 and I21..3, emphasizing variations. The dynamic range implies that if 100% concentration of the Butanedione gives an emission that almost overexposes the film, concentrations below 4% Butanedione will not be recorded.
Aside from the increase in apparent intensity variation, the film cuts off the ends of the light distribution by saturation in the case of overexposure, and no image in the case of underexposure. Overexposure is indicated when the normally mottled appearance is totally washed out to give an entirely white area. The mottling will be discussed below.
The reproductions are again done with a film of slope 1.3, but greater dynamic range, so that in examination of this document visual intensity varies as the original intensity to the 1.7, and there is a slight loss in the illumination range from the original data (the faintest portions).
Quantitatively, the variation in the beam intensity, must also be taken into account, but for the purposes of visual inspection, this effect is negligible.
Lastly, the bright spot on the edge of the circle at 4-5 o'clock is a reflection of the beam off of an internal window recess at maximum exposure and minimum beam absorption.
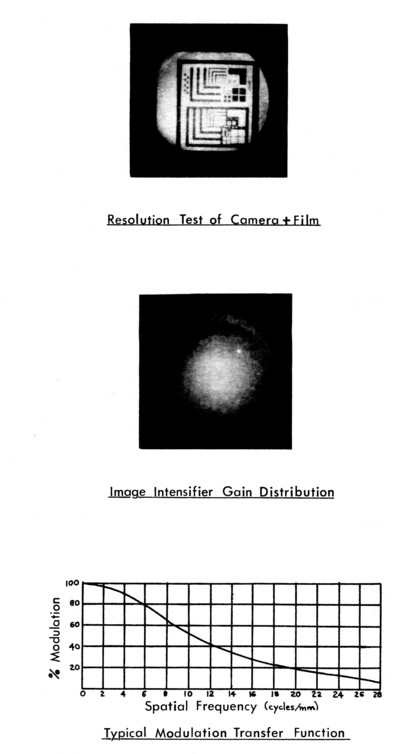
Figure 12. Image intensifier characteristics.
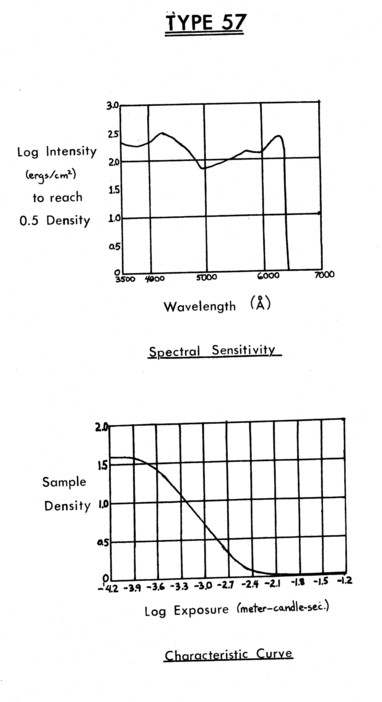
Figure 13. Polaroid film characteristics.
7.3 The Flow Scene
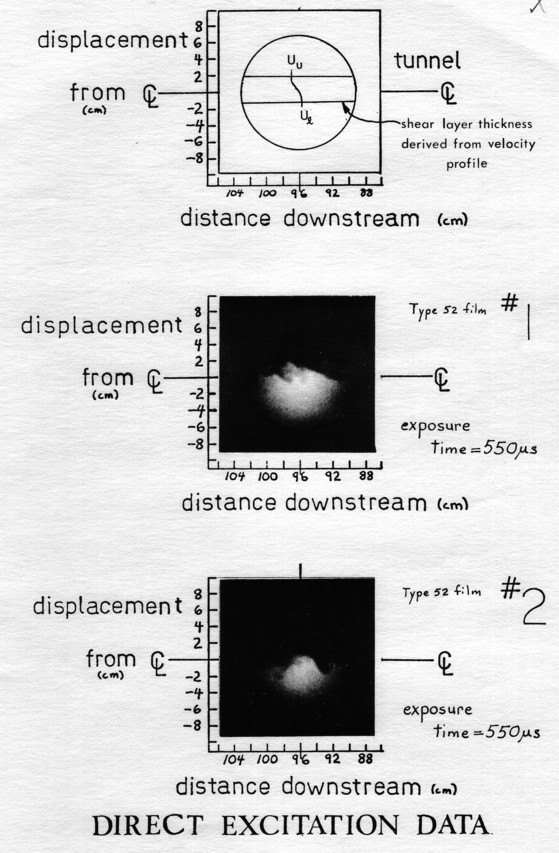
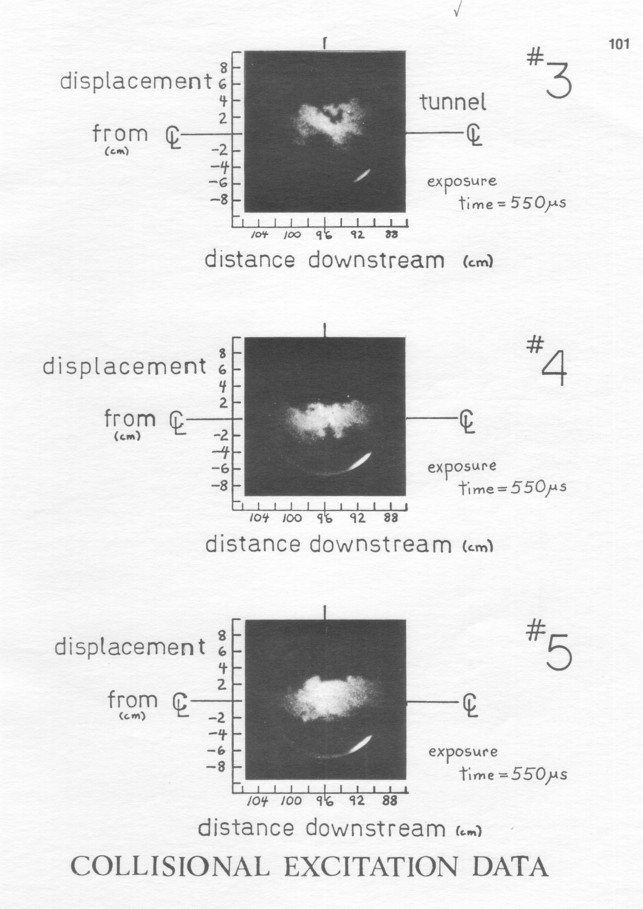
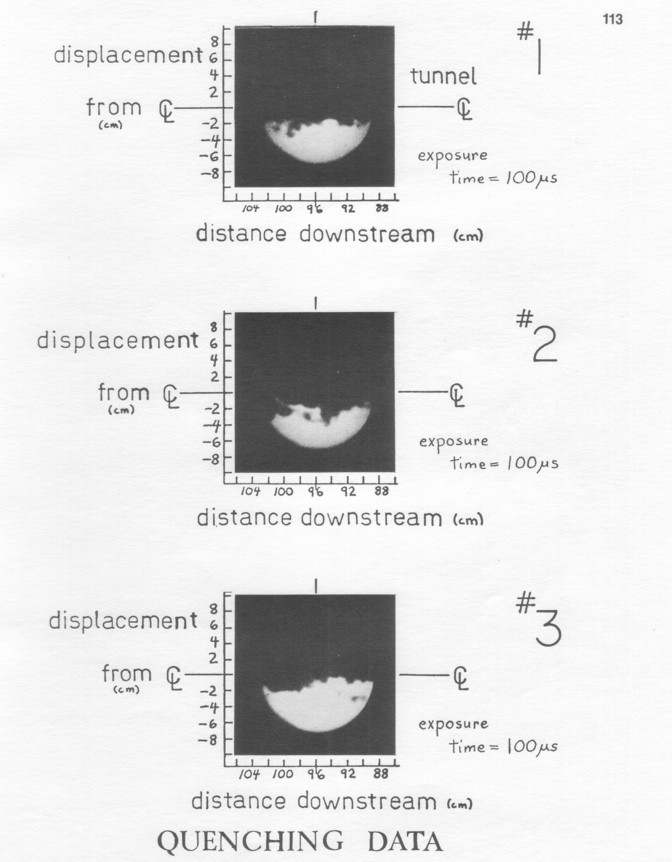
In all of the photos, the flow is right to left, with the Butanedione seeded uniformly into the lower free stream. Nominal flow velocities are 6.0m/sec for the lower free stream, and 7.0 m/sec for the upper stream for every picture. In the case of collisional excitation and quenching, the complementary chemicals to Butanedione are uniformly seeded into the upper stream in every case.
The scene is centered 96 cm downstream of the splatter plate tip, and is 14.5 cm in diameter. This is about the maximum viewing area that could be obtained with the 55 mm f 1.2 lens through the 100 cm window, given the 18 mm diameter image intensifier face. The flow scene is demagnified by a factor of 8.07 on the intensifier face.
Each photograph is accompanied by coordinates that give the true scale of the flow structures. These are measured in terms of the distance downstream of the splatter place, and the displacement from the geometric centerline of the tunnel. The tunnel centerline is marked on both sides of each picture to indicate the true horizontal in the flow.
The pictures have been positioned carefully so that the tunnel centerline is accurate in position to 5% (+ 4mm) and in rotation to a few degrees from the true horizontal. Positioning is done using the noise dot and intensifier circle, which has been calibrated with the tunnel as described at the end of section 4.6. Where the intensfier output face circle is not shown in the pictures in Appendix II, the original data (always showing the circle)is used to line up f salutes to get the proper reference.
Above the first data in Appendix II, the mixing layer is schematically shown as if the image intensifier could show the mean layer position. The layer position is derived from the mean velocity profiles (shown at the center) as measured by the hot wire anemometer. These measurements are repeatable to within their own accuracy. The mean concentration profiles are about 50% wider because of the preferential turbulent transport of scalars (species, energy) over momentum [19].
7.4. Image Quality
The extent to which information can be deduced from the data is obviously limited by the quality of the image. The spurious effects discussed above make conclusions mote difficult, but do not form the basic limitation. For these pictures, the limiting factors are described by the modulation transfer function, the graininess, and the noise. These three factors are interrelated, but form the best characterization of the independent properties of the photographs that is available.
The modulation transfer function (MTF) describes a component or system, and measures the ratio of the output modulation to the input modulation for an input exposure of a one-dimensional sinusoidal distribution of varying spatial frequency. Essentially it gives the spatial frequency response for the device in question. From it, the image of an object can be deduced, aside from noise considerations. From the MTF, the resolution (smallest discernable size element) can be derived, as well as the spreading in the image of a sharp line in the object: blurring. While the resolution is most commonly a specification of a device, it is misleading and incomplete.
Graininess is the most obvious characteristic of the pictures, giving the images a mottled character even in uniform regions. It is described quantitatively as granularity, and measured by taking the density variations within a certain area as the area is moved across the image. The graininess gives a digital appearance to the image.
Noise is the randomly fluctuating component of the image. The noise is seen on the film as density fluctuations. Coming from many sources, types of noise can be most usefully separated into those that are signal related and those that are not.
The data presented in Appendix II are described by these three factors. The large majority of the pictures do not contain visible noise that is not inherent in the phosphorescence signal. The worst example of this noise is #15 of the collisional excitation photos, which in this case is due to reflection from the input beam.
The overall MTF, graininess, and signal related noise seen in the data have contributions from the gas emission, the image intensifier, and the film. The effects of other components and factors are minor. Although the three factors cannot be specified precisely, they can be approximately given by specifying their major contributors.
The image intensifier is responsible for most of the limitations in MTF, grain, and signal related noise of the imaging system. The MTF of the intensifier is shown in Figure 12; its resolution is 25-28 linepairs per millimeter. This means that a black and white line pattern of 25 cycles per mm. on the intensifier input face will result in the same pattern on the output face that varies by only 1/10 of the input amplitude. Thus the smallest visible scale should be about 0.04 mm on the image intensifier face. For the 8:1 demagnification, this implies a 0.3 mm resolution in the flow (0.1 mm. in the data in Appendix II).
The grain of the data pictures is due to the discreteness of the intensifier amplification and fiberoptic transmission. This grain appears to be the factor determining the overall MTF of the intensifier. Although the intensifier grain interacts with the film grain it is believed that the intensifier grain is the dominant effect.
The intensifier grain also appears on the film as signal related noise, since it imposes a random fluctuation on any amplified emission from the flow. This signal related noise makes the resolution limits of quantitative densitometry worse than that of the image intensifier itself. The resolution of the camera-film imaging system is shown by a test pattern in Figure 12.
CHAPTER VIII
Data Analysis
8.1 Introduction
The total data set presented in Appendix II consists of 27 examples of direct excitation of the Butanedione (variation 1, Figure 4a), 38 of collisional excitation (variation 2, Figure 4b), and 30 of quenching (variation 3, Figure 4c): 95 photos. The three visualization technique variations are complementary, each of the three giving insights that are not obviously implied by the other two.
The pictures make the turbulent property of randomness apparent, but there are definite similarities in flow structure that indicate that there are indeed inherent structures in the flow. At the same time there are facets of the data that are very difficult to understand by looking at known flows. Primary among these are the structures themselves and the dynamics that give rise to them. It seems crucial to explain these structures, but the attempt will not be made at this time.
The data gives structural information in the form of the shapes, the placement, and the interrelationships of the structures. It gives mixing information through structural and concentration deductions. Furthermore, based on structural and mixing deductions, conclusions can be made about basic turbulent processes such as intermittence and entrainment.
8.2 Overall Data Assessment
The data confirms the validity of some important experimental techniques. Uniform chemical seeding is verified by the quenching photographs that show uniform emission from the free stream. Furthermore, the mixing layer position implied by the three technique variations is consistent with that given by the velocity profile of the layer. The consistency of the data with the technique description and the experimental conditions implies that deductions from the data can be made with security, within the known limitations.
Collisional excitation pictures show most clearly that the scene width is 3-4 times the mixing layer mean concentration width. Since the largest turbulent fluctuation scale is supposedly the mixing layer width, this viewing area allows the different flow structures to be put in the proper context of their surrounding fluid in each picture.
The smallest discernable scale in the photos is not that of the imaging system (0.3 mm in the flow) in most cases. Other effects that increase this scale are the 3-dimensionality of the flow, motion blurring, and the sharpness inherent in the structures themselves.
Motion blurring is the only one of these that is easily defined. Since the exposure time varies from 50 µ s to 550 µ s, the flow of 6.5 m/sec average velocity will move from 0.3 mm to 3.5 mm during that time implying blurring on those scales. The exposure time of each photo is given beneath it. Most exposures are 100-200 µ s, but the collisional excitation photos are exposed longer (400 or 550 µ s) because of the lower light levels, giving consistently slightly worse resolution (as given above) than the other photos. The blurring due to 3-D effects results from the 1-2 mm beam thickness, which blurs sharp structures that vary across the thickness. The best case resolution is seen in Quenching picture A, which show lines sharp down to the image system limit.
Care must be taken in interpreting the data, due to the limitations in deducing a 3-dimensional dynamic phenomenon from an instantaneous cross sectional measure of it. Remember that each photograph is taken in a different run, so that the pictures are statistically independent.
8.3 Data-Deductions.
There are many striking aspects of the data. In one sense the structures confirm notions of turbulence as a random flow phenomenon, in that the structures are never exactly the same. In another sense the structures are surprising; they are almost always connected.
This connectedness of the emitting structures is strongly implied by the data from all of the three technique variations. Exceptions are some cases of lumps of fluid in the collisional excitation pictures (#23 for example) that are small but apparently disconnected. In order to see what this implies about the structures, first consider how it might come about. There are two sources from which disconnectedness would arise from conventional concepts of turbulence.
The first has to do with the actual disconnecting of the clumps. For a clump to be separated, it must be pulled away first, then the connection to the original fluid must be broken. The breaking occurs by molecular action when the connection is thin enough. In the case of direct excitation and quenching (variations I & 3) this process would be seen as the following sequence:
This assumes the process to be two-dimensional. The data indicates that this process does not occur for large-scale structures (although it does for small scale structures - see quenching data #12 & #24). In the case of collisional excitation, to the above separation process must be added another:
In this case the disconnection is achieved by fluid from one stream or the other breaking through the region of mixed fluid, leaving only a very thin region of molecular mixing as a connection. The collisional excitation pictures show that this also effectively never happens.
The second source of disconnection is one that only leads to apparent separation. This effect arises from taking a 2-dimensional cross-section of a highly 3-dimensional phenomenon. A schematic example is:
The data indicates that this does not happen significantly either. In fact, due to the otherwise almost total connectedness, this effect probably accounts for the few isolated islands of emission that are seen. Since this effect is not observed, the convolutions (which are extreme) must occur primarily in the plane of the photos, and to a much lesser degree normal to it. This is a statement that the turbulent structures vary only slowly normal to the plane of the mean shear layer velocities, except for very small scales.
The connectedness thus implies that regions of varying concentration of one species are simply connected to the free stream containing that species, and that the connection is primarily two-dimensional for a plane shear layer. Furthermore, the collisional excitation pictures indicate that there is also a mostly two-dimensional simply connected zone of molecularly fixed fluid that everywhere divides the unmixed flow from either stream, and that this zone is turbulent. This last deduction is made on the basis that the smallest length scale of the turbulence is on the order of the Kolmogorov length scale (~ l mm) which is much smaller than the thickness of the zone seen in the data.
Beyond connectedness, the data seems to imply a fundamental mixing process. The most striking aspect of the data relevant to mixing is that the collisional excitation pictures seem to show a zone of mixed fluid that is of substantially uniform concentration. The concentration seems to vary over a large scale (1-2 average layer widths) and perhaps on a very small scale not resolvable because of motion blurring, but not on intermediate scales. This is supported by the straight excitation pictures, which show the same uniformity, while revealing much fine-scale convolution. Here the concentration (emission) in an area seems to vary slowly except for fine scales. In addition, the uniformity is apparent despite the emphasis of variations that arises from the film contrast. The uniformity tends to indicate that the zone of mixed fluid is slowly varying in concentration except on fine scales, rather than highly non-uniform as might be expected from preconceptions of turbulence. If true, this is a remarkable finding.
The highly non-uniform nature of previous turbulence measurements is easily explained by the highly convoluted structure passing any fixed probe.
This finding does not go against any established data, because this data is the first unequivocal measurement of its kind - one that measures the fluid that is only mixed on a molecular scale, and not time averaged.
If this conclusion is valid, then the distribution of molecularly mixed fluid across the layer in terms of a probability distribution will be given primarily by the distribution of the highly convoluted structure itself.
The hypothesis of this uniformly mixed convoluted zone supports and is supported by a general mixing process that is suggested by the data. That mixing process is a "bursting" from one free stream, followed by decay inside the layer. This hypothesis is not new, being a well known phenomenon of transition to turbulence, 20 but it is less familiar as a fundamental process of turbulence. Such an effect has been found to be a basic process of turbulent energy supply in boundary layers by Morino and Brodkey [21]. What appears to happen is that an instability process causes extreme agitation of the layer periodically, while between these "bursts," the motions decay internally. In terms of the data, the agitation takes the form of degree of convolution, and the decay smoothes out these convolutions.
This process is inferred from the statistics of the data, the structures involved, and the necessity of steady energy input into the flow, together with its decay.
The structural information comes primarily from the collisional excitation and quenching photos. In the collisional excitation data, while most of the emitting structures are highly convoluted, there are a few (#32 & #34) where these convolutions are totally absent. The data definitely shows that the degree of convolution varies dramatically. That the variation in convolution is not primarily internal to the shear layer is shown by the quenching photographs. Here it can be seen that the boundary between molecularly mixed and unmixed fluid undergoes a similar variation between relative quiescence and a highly convoluted state (extreme examples: #7 vs. #13). However, in the case of the convoluted boundary it can be seen that unmixed fluid has been coincidentally injected into the layer (#16) in the form of a large number of small-scale whisps. Such whisps are clearly absent above smooth portions of the concentration boundary. The last link of the reasoning is the identification of the convolutions and fluid injection with a high-energy phenomenon, a reasonable conclusion based on non-turbulent fluid mechanics.
Statistical support comes from the internal consistency of the energy and species injection followed by decay. Since the layer is turbulent from constant mean flow energy input, if this energy input is in the form of bursts from the free stream, this bursting should only appear periodically (random period) with intervening periods of quiescence. This is observed, in that the quenching photos show the bursting to be an isolated phenomenon rather than steadily occurring. Also, because of the random nature of the bursting, one expects a few cases where the convolutions have entirely smoothed out - as is seen in a few collisional excitation photos.
Furthermore, this hypothesized process is consistent with what is already known about various turbulent processes.
It is consistent with the turbulent energy cascade from large to small scale. In conventional terms, the transfer process is through decreasing vorticity scales. In the photos the vorticity scales can be identified with the convoluted structures, and rather than transfer between pseudo-steady state vortices, the data indicates an apparently energetically equivalent decay of the entire spectrum periodically. This particular aspect may be confirmable by conventional techniques.
Lastly, the hypothesized mixing process is consistent with what is known about turbulent entrainment (see section 2.2). Two forms of entrainment are indeed seen, the one a slow nibbling of the free stream, the other large scale addition to the layer. However, the data indicates that the latter process is not engulfment, but more similar to a randomly occurring large amplification of the nibbling process. This result is consistent with the concept of engulfment, in that a large volume of fluid is entrained at once, but it shows the concept to be misleading. As with the conclusions from the collisional excitation data, these deductions from the quenching data arise from information that is unique at this time; no information conflicting with the above entrainment process is yet extant.
In summation, the physical description that emerges from the data set seems to be consistent from many viewpoints. The inferences drawn here are not certain, due to limitations of the visualization technique, but their validity is strongly supported by their explanation of many interrelated facets of the data and known turbulent processes. The bursting and decay turbulence process forms a unified, consistent, reasonable whole.
Finally there remains a large number of unexplored inferences that can be made from the data. There seem to be no large scale coherent structures as found by Brown and Roshko, a fact which may support the attainment of self-preservation in the experimental shear layer visualized here. There does seem to be a very large wave structure seen in the data though. It is most evident in #8 of the quenching photos, where the whole layer seems sloped improperly. The half wavelength of the disturbance must be more than 5 average concentration layer widths. Also, an amazing similarity of structure slopes can be seen in the direct excitation photographs. The overall approximate mean slope is 30% and it may be an indication of the mean strain field. There are many other unknown but fascinating structures present, such as the trailer of mixed fluid in the free stream in #20 of the quenching photos.
CHAPTER IX
Conclusions
The data contains a large amount of new information about turbulence. Both the collisional excitation and quenching data, showing only the molecularly mixed and unmixed fluid respectively, are totally new measurements. Together the three visualization technique variations result in a large data set that offer many possibilities for analysis, only a few of which have been exploited here.
One conclusion (see Appendix II) is that the emitting concentration structures all seem to be simply connected, except on fine scales. The most remarkable facet of this result is the existence of a molecularly mixed zone inside the mixing layer that totally separates the unmixed (molecularly) fluid from the two free streams. This implies that mixing only takes place between the pure species and partially mixed fluid, not between the pure species separated by a thin molecular scale sheet. This has wide ramifications for turbulent combustion analysis. Furthermore the connected structure varies only slowly in a direction normal to the mean flow velocities, again with the exception of very fine scales.
The data also leads to the hypothesis that the fundamental turbulent mixing process is one of random bursting from the free stream followed by decay of the highly energetic, highly non-uniform and highly convoluted structures within the shear layer. The hypothesis suggests that the turbulent energy cascade from larger to smaller scales is an overall randomly periodic creation and decay of the scales, rather than a pseudosteady state transfer between vortices of decreasing scale.
Lastly, the data seems to show and explain the two currently known turbulent entrainment processes. The first, and slower, consists of drawing off thin streams of fluid from the free stream, such as is currently pictured. The second, and more rapid, process is seen as a local large amplification of the first process, leading to large additions of fluid locally over a short time. This is seen to be the correct explanation of the experimentally well known rapid addition of large amounts of free stream fluid locally. An engulfment by the convoluted boundary as has been postulated prior to this work.
CHAPTER X
Recommendations for Future Work
10. 1 Experimental
The experimental technique, as presented here, has only been developed to ts first stage. The next two stages that are feasible, if difficult, are:
1) take quantitative data
2) increase the photo repetition rate to permit the recording of a motion picture of the flow structures.
To get an immediately useful input to a turbulent mixing model the first is more important. For a long term understanding of the turbulence itself, the value of the second cannot be overstated. It would probably go a long way toward a full understanding of the structures that are seen in this work.
The phosphorescent gas visualization technique also has broad application to different types of flows. It is not a simple technique, however, and is attractive principally because of the unique information it gives.
Finally, a very desirable addition would be to record more of the Three-dimensional aspects of the flow. This could be done by changing the cross-section of the flow that is examined.
10.2 Theoretical
The structural approach has never been taken in the analysis of turbulence. It is hoped that this work will spur progress in this respect. Furthermore, the present understanding of vorticity dynamics is abysmal. Vorticity is the crux of turbulence, and significant progress in analyzing the structures of turbulence will not be made until there is improved physical and analytical understanding of the vorticity, in the opinion of the author.
CHAPTER XI
Summary
The aim of this work has been to contribute to the further fundamental understanding of fluid turbulence by visualizing its detailed flow structures. In this approach, coherent spatial and velocity structures are assumed to result in the statistical behavior of a turbulent flow. Examination of these structures then gives information about the turbulent flow that cannot be deduced from the statistics of the flow. This information should reduce the role of empiricism in the analysis of turbulence.
The experimental method chosen is to visualize a turbulent plane free shear layer, using stop-action photography of a phosphorescing trace gas. This visualization technique gives a cross-sectional concentration map and allows separate recording of turbulent fluid elements that either are, or are not mixed on a molecular scale. Choice of direct photo-excitation, collisional excitation, or collisional de-excitation of the phosphorescing gas permits identification of the emission with the degree of mixing inside the layer.
The plane shear layer visualized has been measured with a hot wire anemometer. Self-preservation of the shear layer at the point of inspection can be verified by four conditions that have been determined experimentally for the nominal flow. These are the free stream velocities, their turbulence levels, the number of initial momentum thicknesses from the mixing layer origin to the inspection point, and the Reynolds number at that point. Unfortunately these conditions imply that self-preservation of the flow visualized is only probable and not certain, because the present criteria described in the literature are not complete.
A data set of approximately 30 statistically independent photographs of each technique variation has been taken, and put in the context of the tunnel geometry in Appendix II.
The collisional excitation and quenching photographs present information available for the first time. They provide a great deal of information on turbulent mixing, little of which has been directly measured before. The instantaneous concentration maps are to be contrasted with time averaged concentrations that give spurious values for the average molecularly (vs. turbulently) mixed concentrations.
Together, the three visualization technique variations suggest a general process of turbulent mixing in the form of a bursting of fluid from one stream followed by decay inside the layer. This hypothesis explains consistently the major aspects of the data, and is supported by what is currently known about turbulent mixing.
More specifically, the concentration structures are found to be highly convoluted but simply connected, without sharp convolutions normal to the plane of the two-dimensional mean shear layer. Furthermore, the collisional excitation data shows that there is a simply connected layer of mixed turbulent fluid that always divides the pure species that come from the free streams. This has very important implications for turbulent combustion analysis, since it implies that mixing between essentially pure material from either stream does not occur; it only occurs between pure material and molecularly mixed material.
Finally, the data suggests that turbulent entrainment is one varying process of nibbling of material in the free stream by the shear layer. The nibbling is slow in most cases, consistent with one known entrainment process, but periodically it is greatly amplified locally. This local amplification adds a large amount of unmixed fluid to the layer rapidly, a phenomenon long recognized experimentally. However, this process has been incorrectly explained by large scale engulfing of fluid from the free stream by the convoluted layer boundary.
These conclusions are plausible but tentative, pending further work. In any case there is clearly much potential for future advances in the fundamental understanding of turbulence through examination of its detailed structures.
Stephen C. Bates
GTL Report No. 134 June 1977
Acknowledgements: Thanks to thesis advisors Profs.D.B. Stickler and J.L. Kerrebrock. This research was carried out in the Gas Turbine Laboratory, M.I.T., supported by Pratt & Whitney Aircraft Division, United Technologies Corporation (formerly United Aircraft Corporation).
REFERENCES
1. Tennekes, H., and Lumley, J.L., A First Course in Turbulence, MIT Press, Cambridge, MA, 1972, p. 131.
2. Ibid., p. 128.
3. Sabin, C.M., "An Analytical and Experimental Study of the Plane Incompressible, Turbulent Free Shear Layer with Arbitrary Velocity Ratio and Pressure Gradient," Stanford University, AFOSR-TN-5443, October, 1963, p 25.
4. Townsend, A.A., "The Mechanism of Entrainment in Free Turbulent Flows," J. Fluid Mech., 26, 1966, pp. 689-715.
5. Corrsin, S., Kistler, A.L., "Free Stream Boundaries of Turbulent Flows, NACA Report 1244, 1955.
6. Bradshaw, P., "The Effect of Initial Conditions on the Development of a Free Shear Layer," J. Fluid Mech, 26, part 2, 1966, pp. 225-236.
7. Brown, G., and Roshko, A., "On Density Effects and Large Structures in Turbulent Mixing Layers," J. Fluid Mech., 64, part 4, 1974, pp. 775-816.
8. Chandrasuda, C., and Bradshaw, P., "An Assessment of the Evidence for Orderly Structure in Turbulent Mixing Layers," Imperial College, Aero. Report 75-03, May, 1975.
9. Browand, F.K., and Weidman, P.D., "Large Scales in the Developing Mixing Layer," J. Fluid Mech., 76, part 1, 1976, pp. 127-144.
10. Okabe, H., and Noyes, W.A., "The Relative Intensities of Fluorescence and Phosphorescence in Biacetyl Vapor," J. Am. Chem. Soc., 79, 1957, pp. 801-800.
11. Heicklen, J., "The Fluorescence and Phosphorescence of Biacetyl Vapor and Acetone Vapor," J. Am. Chem Soc., 81, 1959, pp. 3863-3866.
12. Ishikawa, H., and Noyes, W.A., "Photosensitization by Benzene Vapor: Biacetyl. The Triplet State of Benzene," J. Chem Phys., 37, #1, 1962, pp. 583-591.
13. Turro, N.J., and Engel, R., "Quenching of Biacetyl Fluorescence and Phosphorescence," J. Am. Chem Soc.,, 91, 1969, pp. 7113-7121.
14. Porter, G., and Wilkinson, F., "Energy Transfer from the Triplet State," Proc. Royal Soc. of Eng., 264, 1961, pp. 1-18.
15. Epstein, A.H., "Fluorescent Gaseous Tracers for Three Dimensional Flow Visualization," S.M. Thesis, Department of Aeronautics & Astronautics, M.I.T., June, 1972.
16. Epstein, A.H., "Quantitative Density Visualization in a Transonic Compressor Rotor," Ph.D. Thesis, Department of Aeronautics & Astronautics, M.I.T., September, 1975.
17. Okabe, H., and Noyes, W.A., op. cit.
18. Ishikawa, H., and Noyes, W.A., op. cit.
19. Mayer, A., and Divoky, D., "Correlation of Intermittency with Preferential Transport of Heat and Chemical Species in Turbulent Shear Flows," AIAA J, 4, #11, November, 1966, pp. 1995-2000.
20. Schlichting, H., Boundary Layer Theory, McGraw-Hill, New York, 1968, p. 431.
21. Cornio, E.R., and Brodkey, R.S., "A Visual Investigation of the Wall Region in Turbulent Flow," JFM, 37, part 1, 1969, pp. 1-30.
APPENDIX I
COLLISIONAL EXCITATION EMISSION DEPENDENCE
nB* = number of excited benzene molecules per unit volume at lmm benzene partial pressure; 1% of beam is absorbed over 10cm and the absorption is proportional to the benzene concentration.
Beam energy = losses x flash energy
= (200 joules)(0.65)(3 x 10⁻⁵ )(10-2)(10-1) (see Figure 9)
= 8 x 10⁻⁶ joules
in l cm3, for a beam area of 15 cm x l mm:
Energy per cm3 = (0.001)(1.5)(8 x 10⁻⁶ ) joules
= 1 x 10⁻⁸ joules/cm3
Energy per photon at 2500A = 8 x 10-19 joules
=> 1 x 10¹⁰ photons absorbed
nB = 5 x 10¹⁶ molecules/cm3 at 1 atm, lmm Hg
n*/ nB = 2 x 10⁻⁷
and inside the mixing layer nB = 2 x 10⁻⁷ (local partial pressure)/(l mm Hg)
The collision frequency for the typical butanedione free stream concentration of l mm is
107 coll/sec (20°C)
There are an average of 10 collisions before energy transfer between a benzene and butanedione molecule takes place. Thus in the 100μs flash pulse time, 103 collisions take place between each excited benzene molecule and a butanedione molecule.
For energy transfer of each excited benzene molecule, ten collisions must take place, so that all of the molecules transfer energy to butanedione molecules down to about 1% of the free stream butanedione concentration, since the butanedione concentration is always much greater than the concentration of excited benzene molecules.
APPENDIX II
PLANE SHEAR LAYER VISUALIZATION DATA
