Infrared Monitoring of Combustion
Stephen C. Bates*, Philip W. Morrison Jr.**, Peter R. Solomon***
ABSTRACT
The use of Fourier Transform Infrared (FT-IR) spectroscopy for combustion monitoring is described. A combination of emission, transmission, and reflection FT-IR spectroscopy yields data on the temperature and composition of the gases, surfaces and suspended particles in the combustion environment. Detection sensitivity of such trace exhaust gases as CO, CO2, SO2, NOx, and unburned hydrocarbons is at the ppm level. Tomographic reconstruction converts line-of-sight measurements into spatially resolved temperature and concentration data. Examples from various combustion processes are used to demonstrate the capabilities of the technique. Industrial measurements are described that have been performed directly in the combustion zone and in the exhaust duct of a large chemical recovery boiler. Other measurements of hot slag show how FT-IR spectroscopy can determine the temperature and optical properties of surfaces. In addition, experiments with water droplets show that transmission FT-IR data yield spectra that characterize particle size and number density.
NOTATION
* President, Thoughtventions Unlimited LLC, Glastonbury CT
** Professor, Case Western Reserve University, Cincinnati, OH
*** Retired.
INTRODUCTION
Radiation at the mid-IR wavelengths (1-20μm) contains extensive information about chemical bonds and temperature. By measuring the transmittance, radiance, and reflectance of the stream, one can determine gas properties (temperature and species concentration), particle properties (temperature, composition, size, and number density), and surface properties (temperature and composition).
FT-IR spectrometers modulate their source radiation so that each wavelength has a unique modulation frequency. The detection process results in a signal that is only sensitive to the modulated radiation, so that any emitted or reflected environmental radiation does not interfere with the measurement. The frequency scanning feature of the technique permits simultaneous detection at all wavelengths (6500-500 cm-1; 1. 6-20 μm). Rapid scan spectrometers can acquire the entire mid-IR spectrum in less than 0.1 second per scan, making signal averaging highly efficient.
FT-IR spectrometers can simultaneously measure a sample's emission and transmission or its emission and reflection. A special optical configuration allows the interferometer to capture the information at two different detectors. The FT-IR spectrometer can monitor both the gas phase environment as well as a surface with good spatial resolution (1-10 mm). The computer-controlled spectrometer can also be used to issue process commands [1,2]
The experiments discussed below couple the FT-IR beam into a sample, which is external to the spectrometer. Recent spectrometer designs permit simultaneous emission and transmission measurements. For surface measurements, we replace the transmission optics with a reflection geometry.
The following discussion relies on theory developed previously [3-5]. There are five categories of measurements possible using FT-IR spectroscopy: gases, particles, gases and particles together, tomographic reconstruction, and surface measurements. Each of these areas will be illustrated using examples from experiments with chemical combustion, coal/water slurry combustion, a water aerosol, and slag heating.
2. GASES
For a stream containing only gases, transmittance is related to gas concentrations through Beer's law:
τ(ν) = I/Io = exp [-αg ν) L] ......................(1)
where I = intensity of radiation transmitted through the sample at a given wavenumber, ν, IO = intensity of transmitted radiation with no sample, αg(ν) = absorption coefficient of the gas, and L = path length of the IR beam through the sample. The absorption αg(ν) is zero outside the gas absorption bands and is proportional to the gas concentration inside the absorption bands. Some gases such as N2, O2, and H2 are IR inactive, whereas more complex gases have absorption bands at characteristic wavenumbers. Figure la shows the 1- τ(ν) spectrum of a mixture of hot gases 1- τ(ν) ≈ αg(ν) L for small concentrations). For combustion systems the completeness of the IR spectra over all wavenumbers can be used to determine the total gas composition; both the absolute and relative amounts of the various species produced [6,7]. This allows many inferences to be drawn about the combustion processes.
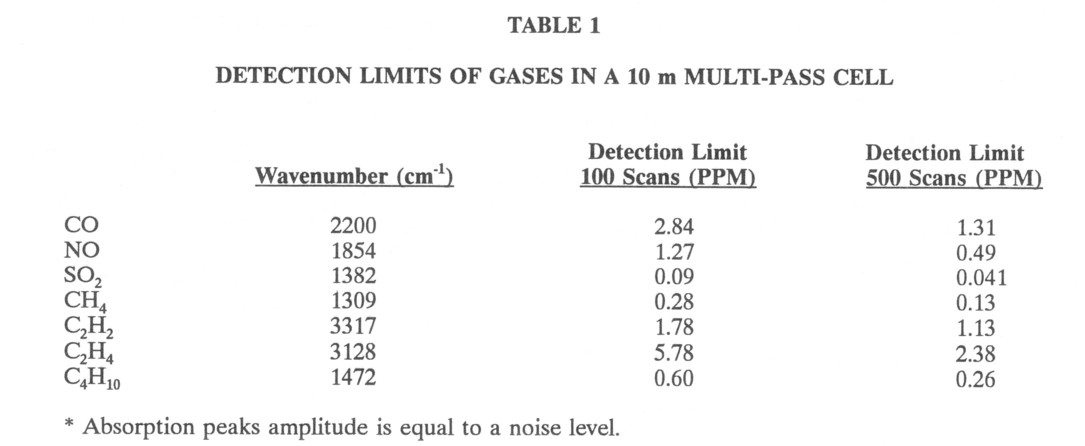
FT-IR spectroscopy is also used for analysis of trace gases. At low concentrations a multipass cell is used to increase the absorption. Measurements in this laboratory and by other authors' show that the sensitivity limit for various gases in a 10 m pathlength is less than a ppm (Table 1) at 1 atm. This pathlength is easily folded into a cell 30 cm long using multiple reflections.
Emission (or radiance R(ν) from a hot gas can be used to determine gas temperature. The radiance is related to gas temperature and concentration by
R(ν) = [1- τ(ν)] Rb(ν,Tg).....................(2)
where Rb(ν,Tg) = Planck function at the gas temperature Tg. The Planck function describes the spectral power of a perfectly absorbing black-body as a function of temperature. The 1- τ(ν) factor accounts for partial transparency of the gas τ(ν) = 0 for a completely opaque gas). Figure 1b shows the radiance from the hot gases described by the spectra shown in Fig. la. Note that the gas radiates only in the bands where it absorbs radiation. Equation 2 can be recast by defining the normalized radiance Rn(ν):
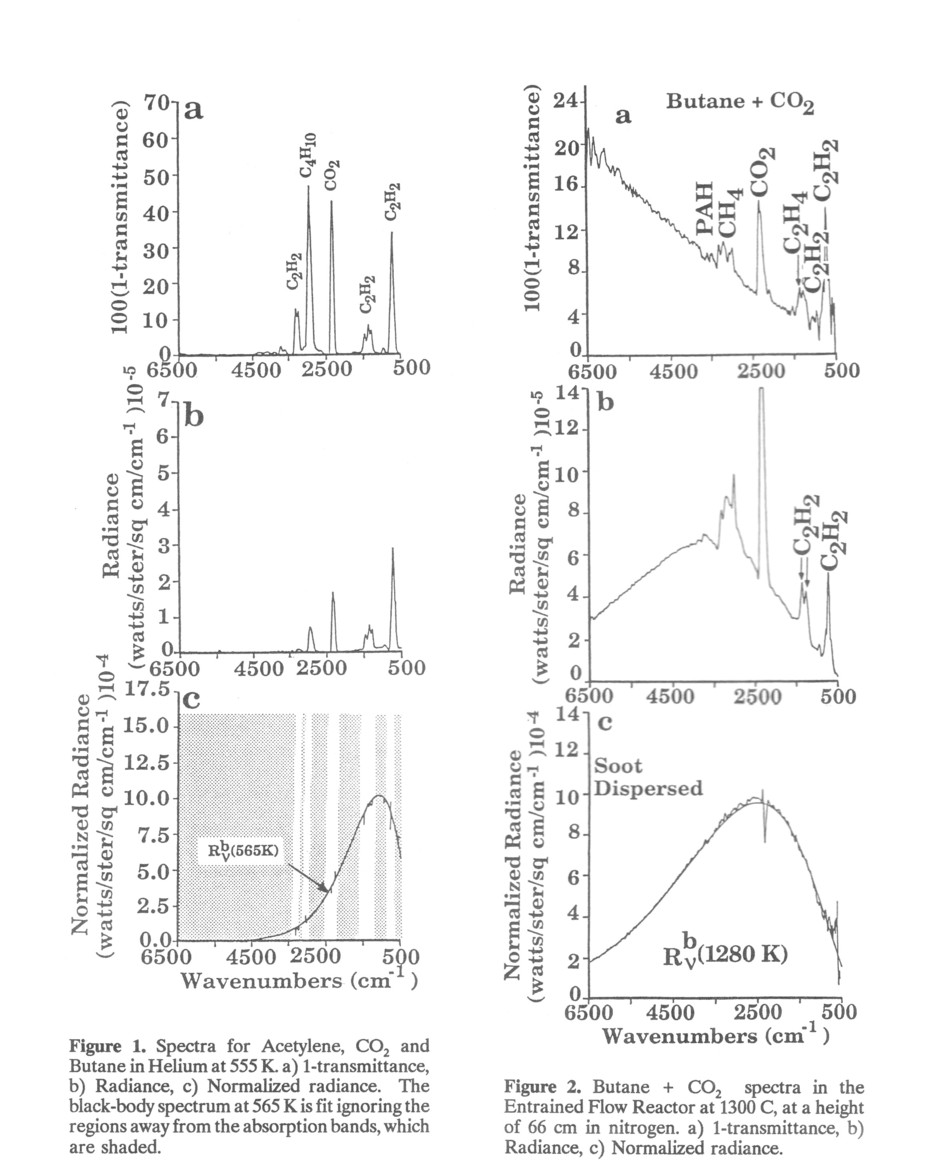
Rn (ν) = R(ν)/ 1- τ(ν).........................(3)
Comparison of Eqs. 2 and 3 shows that
Rn (ν) = Rb(ν, Tg)...................(4)
wherever αg(ν) is nonzero. Thus T can be determined by measuring τ(ν) and R(ν), calculating R,(Y), and choosing a T g such that Rn (ν)= Rb (ν,Tg). Figure 1c is an example of such a measurement. The FT-IR measurements yield a gas temperature of 565 K while thermocouple measurements indicate 555 K. This measurement becomes more difficult as more of the spectrum is covered by absorption bands.
3. PARTICLES
Particles are commonly part of combustion streams, in the form of soot or ash. Considering particles in a nonabsorbing gas, absorption and scattering combine to cause extinction of incident radiation. If one defines the efficiencies of absorption (Fabs) scattering (Fsca), and extinction (Fext) theory can relate τ(ν) and Rn (ν) to these quantities:
τ(ν) = exp[-NAFext (ν)L] τ(ν)........................(5)
Rn(ν) = R(ν)/(1- τ(ν)) = [Fabs (ν) /Fext (ν)]Rb (ν,Tp).........................(6)
where N = number density of the particles, A = cross sectional area of a particle, TP = particle temperature, and Fext = Fabs + Fsca. Equation 5 shows that -ln τ(ν) is proportional to the particle number density. Furthermore, since Mie theory can predict Fext, = Fabs, and Fsca [9], τ(ν) also contains size information (see below). Rn(ν) provides temperature of the particles in two limiting cases: a) Fabs / Fext ≈ independent of ν and b) Fabs / Fext ∼ 1. Fortunately, these two limits are very common in the wavelengths of the mid-IR.
In the first case, the function Rn (ν) has shape similar to that of a black-body radiator, but its amplitude is less than Rb (ν,TP); The normalized radiance for such particles approximates that of a grey-body. In the second case, the particles do not scatter, and Rn (ν) is identical to that for a black-body. Soot particles are an example of this behavior. Figure 2 presents 1- τ(ν), R(ν) and Rn (ν) for a mixture of gas and soot at the same temperature. The soot produces the broad sloping continuum attenuation shown in Fig. 2a and the broad continuum emission spectrum shown in Fig. 2b. Individual gas bands can be seen superimposed on the broad soot continuum. Figure 2c demonstrates that Rn (ν) is identical to that of a black-body. A temperature of 1280 K determined by matching this spectrum to that of a theoretical black-body is in good agreement with a suction pyrometer measurement of 1295 K. Since both gas and soot are at the same temperature, Rn (ν) also matches Rb(ν,Tp) in the region of the gas absorption band[3].
3.1 Particle size analysis
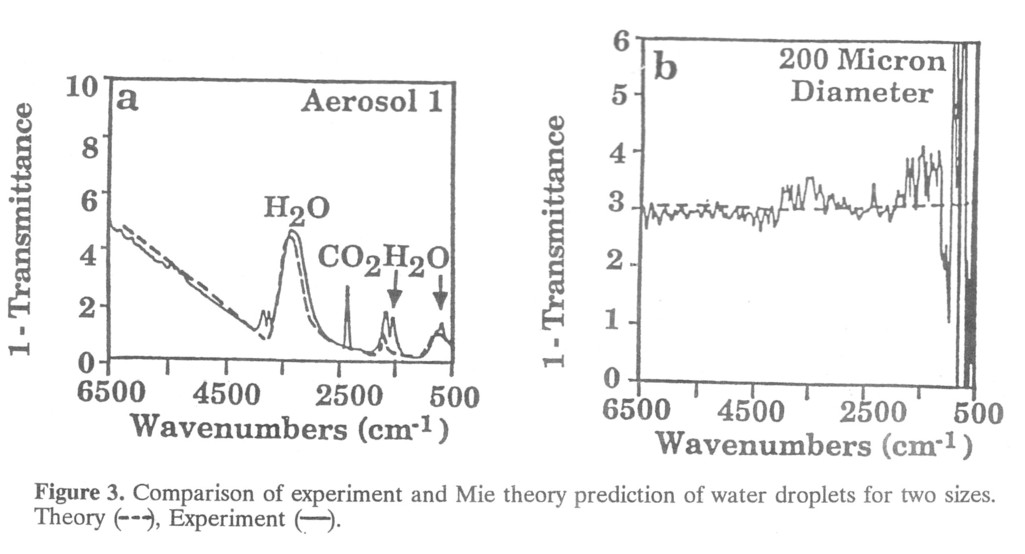
The transmission spectrum of the particle-laden gas stream contains detailed particle size information. Consider the case of water droplets of diameter D. When D is large (> 100 μm) diffraction scattering is negligible at IR wavelengths less than 20 μm, and the particles scatter or absorb all the light incident upon them. As a consequence, Fext (ν) is approximately independent of ν, and the 1- τ(ν) through a collection of such particles is a constant amplitude spectrum (Fig. 3b). (The data appear as 1- τ(ν)because Eq. 5 shows that 1- τ(ν) is proportional to NAFextL when NAFextL < < 1). If D is less than 50 micrometers, diffraction scattering begins to affect Fsca(ν) in addition to the reflection scattering. In this case the transmittance has broad absorption-like feature at a wavelength that is related to D. This feature occ urs at higher wavenumbers (shorter wavelengths) as D decreases. For micron size particles, this feature is above 6500 wavenumbers, causing the sloping background shown in Fig. 3a. Mie theory describes this exactly, allowing generalization of these sizing results to an arbitrary particle composition. Figure 3 shows the Mie theory predictions for the water droplets using the known optical constants of water, varying the diameter until a good fit is achieved. Deconvoluting the spectrum of a mixture of sizes also appears to be feasible if the optical constants are known or spectra of known size cuts exist. Solomon et al [5] discuss determination of the optical constants of particles.
4. PARTICLES AND GASES
The most complicated case is a stream that contains both gases and particles. Theory predicts that the particle spectra and gas spectra superimpose:
τ(ν) = exp{-NAFext (ν) + αg (ν)]L}..........................(7)
Rn(ν) = R(ν)/(1- τ(ν)) = [NAFabs (ν)Rb (ν,Tp) + αg (ν)Rb (ν,Yg)]/[NAFex (ν) + αg (ν)]............................(8)
In regions where αg (ν) = 0, the above equation reduce to Eqs. 5 and 6.
4.1 Long path measurements in a commercial scale recovery boiler
To demonstrate that FT-IR monitoring is possible in an industrial environment on commercial scale equipment, Advanced Fuel Research (AFR) has conducted a field test of an FT-IR monitor on the recovery boiler of a Weyerhaeuser paper mill in Longview, WA. The primary purpose of the recovery boiler is to burn a process liquid called black liquor to recover the pulping chemicals sodium and sulfur as a molten smelt on the floor of the boiler. Its secondary function is to generate steam. The boiler is 20-40 feet across and produces a very complex gas stream composed of primarily CO2, H2O, and fume particles, plus other trace gases. The fume consists of submicron diameter particles of Na2SO4 and Na2CO3 which must be recovered to reprocess their sodium and sulfur.
The FT-IR apparatus used was a spectrometer, a set of far-focussing optics to project the IR beam through the boiler, two detectors to acquire emission and transmission spectra, and a computer to operate the spectrometer and analyze the data. The spectrometer was a Bomem M110 spectrometer modified by AFR to acquire emission and transmission scans simultaneously. The total path length of the IR beam is approximately 70 ft: 36 ft through the boiler and 34 ft outside the boiler.
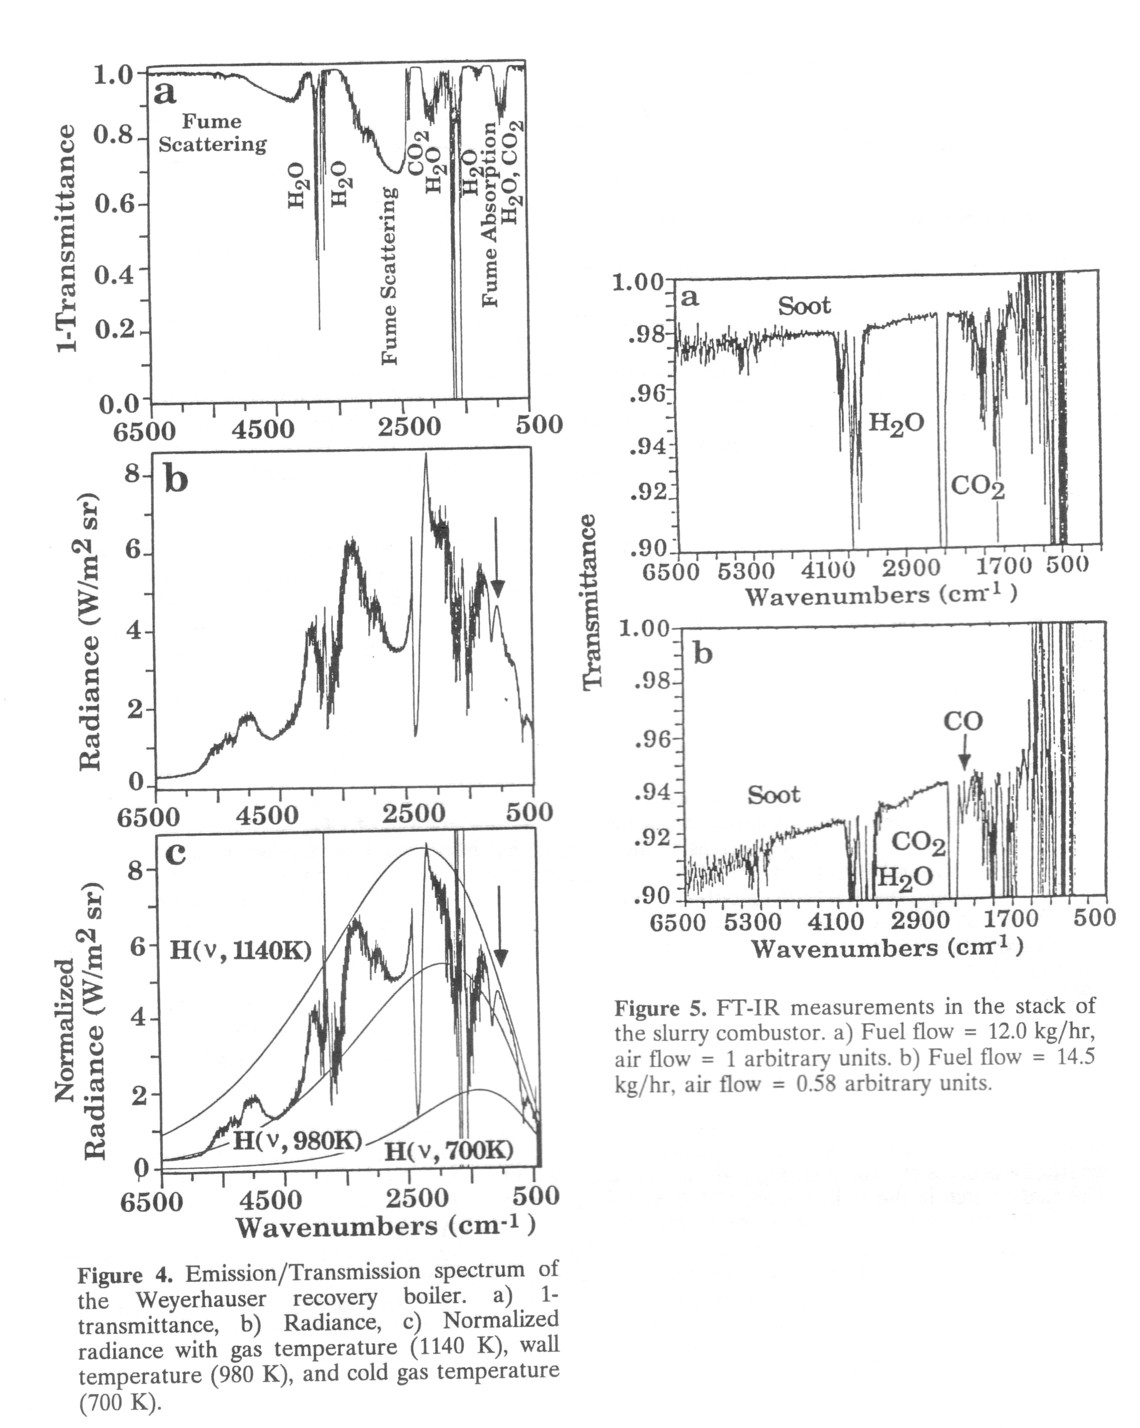
Some of the results of the FT-IR measurements appear in Fig. 4. Although fume is opaque in the visible spectrum as a result of scattering, Fig. 4a shows that the stream is partially transparent for the IR beam. The 1 - τ(ν) spectrum contains opaque regions 1- τ(ν)caused by absorption from CO2 (2350 cm -1), H2O (3500 cm -1) and 1600 cm-1), and the fume (1200 cm-1). The narrow regions of transparency in the H2O absorption bands are artifacts due to division by zero during processing of the data. Since the above absorption bands indicate saturation of the detector, the amount of CO2and H2O must be determined by analyzing weaker portions of these absorption bands or other, weaker absorption bands. Between the CO2 and H2O bands the effects of the extinction properties of the fume can be seen. At high wavenumbers, the 1- τ(ν) is unity because the fume is highly scattering and no IR can penetrate through the 36 ft fume cloud. For the submicron fume particles, however, the scattering decreases rapidly with decreasing wavenumber (similar to the behavior of soot in Fig. 2a), and thus partially transparent windows appear in the spectrum; these are the regions where 1- τ(ν) is less than 1. Near 1200 cm-1 the fume is strongly absorbing, and the spectrum is completely opaque in that region. Although the long path length causes much of the spectrum to be opaque, other gas spectra can be observed. For example, the absence of a strong absorption near 2143 cm-1 (the CO region) indicates that the boiler is operating fairly efficiently.
A set of temperature measurements can be derived from the radiance spectrum (Fig. 4b) and the normalized radiance (Fig. 4c). The radiance spectrum is consistent with the transmittance: in regions where the process stream is strongly absorbing (e.g. the CO2 and H2O bands), it is also strongly radiating. The sharp notch in the radiance near 2400 cm-1 is due to cold CO2 outside the boiler absorbing the hot CO2 radiation. However, at both edges of the band, the radiation from hot CO2 is not absorbed by the cold CO2, and these regions can be used to determine the hot CO2 temperature. Figure 4c contains the normalized radiance and shows that several temperatures are present. The 1140 K curve fits the absorption for CO2 and H2O as well as the fume absorption band; this temperature is both the gas and fume temperature. The 700 K curve fits the cold CO2 band and identifies that temperature. The middle curve is wall radiation scattered by the fume and into the emission detector. A fit of this curve shows that the wall is at a third temperature of 980 K.
Note that Fig. 4b and 4c show a clear emission feature near 1100 cm-1 (marked with arrows). This feature corresponds to a strong absorption band for Na2SO4 found in the fume. Consequently the normalized radiance at 1100 cm-1 yields a fume temperature of 1140 K as shown in Fig. 4c, almost the same as the gas temperature.
4.2 In-stack monitoring of coal combustion products
In-situ stack measurements also give quantitative information on the combustion process. Figure 5 presents two spectra across the stack of a coal water slurry combustor. These spectra are from a series of experiments in which the combustion efficiency is decreasing. Figure 5a indicates fairly efficient combustion because the baseline shift due to soot absorption is low and the CO band at 2143 cm-1 is absent. At the lower combustor efficiency indicated in Fig. 5b, the amount of soot increases and the CO band appears.
5. TOMOGRAPHY
One of the major limitations of any kind of emission/transmission (E/T) spectroscopy is that it measures an average along a line of sight. To obtain spatially resolved information one can employ tomographic reconstruction of multicord data [10]. To validate the FF-IR tomography methods, measurements were performed on an ethylene diffusion flame that had been studied in detail using other methods. At each height in the flame, E/T scans were taken at 11 different locations across the flame. Assuming radial symmetry the E/T spectra can be deconvolved to yield the transmission and emission of a volume element approximately 1 mm3 in size. The data give the concentration and temperature of CO2, H2O, soot, and organics. To test the method the CO2 and H2O temperatures as determined by E/T FT-IR were compared to measurements using both a thermocouple [11] and coherent anti-Stokes Raman spectroscopy (CARS) [12]. The CARS and FT-IR measurements agree quite well, and the thermocouple measurements are 100-200 K below these. It is known that the presence of soot decreases the accuracy of thermocouple measurements. FT-IR and laser scattering" also give similar temperature values for relatively similar soot concentrations.
Images of the flame central plane have been produced in pseudo-color for these temperature and relative concentration fields [10]. The images are formed by interpolation and smoothing from the two-dimensional fields [14] on a Sun 4/110 computer. All of the important forms of carbon and hydrogen are measured as they evolve passing through this flame. This information could be used to test model simulations of the combustion processes in the flame. In a similar manner species temperatures are determined throughout the flame. The technique is unique in its ability to determine spatially resolved soot temperatures. The tomographic reconstruction presents a description of the flame in which fuel in the center of the flame pyrolyses, the pyrolysis products form soot in a sheath, and then the soot burns at the outside of this sheath.
An interesting feature of the flame is illustrated in contour plots shown in Fig. 6. In the region where there is appreciable soot, the temperature is fairly constant between 1600 and 1750 K whereas very high temperature gradients exist outside of the soot region. The soot has effectively damped out highest temperature fluctuations as a result of the good thermal coupling to the surrounding gas through the high emittance of the soot.
6. SURFACE AND THIN FUM MEASUREMENT
Recent experiments also show that FT-IR can measure the temperature and optical properties of surfaces and thin films. These techniques rely on in-situ reflection and emission spectroscopy.
The radiance of a hot surface is a function of the emissivity of the surface and the temperature of the surface: є(ν)Rb(ν,Τ). Using conventional optical methods to determine temperature, one must either measure the surface radiance and know є(ν) at one value of ν, or make a radiance measurement and a reflectance measurement together. The reflectance (ρ(ν) determines c since є(ν) = I - c for an opaque surface. Under some special conditions, however, the material has a wavenumber νcwhere є(νc) = 1. This occurs because ρ(νc) = 0 and is known as the Christiansen effect [10]. The Christiansen effect is very useful be cause most dielectrics will have at least one νc somewhere in the mid-IR.
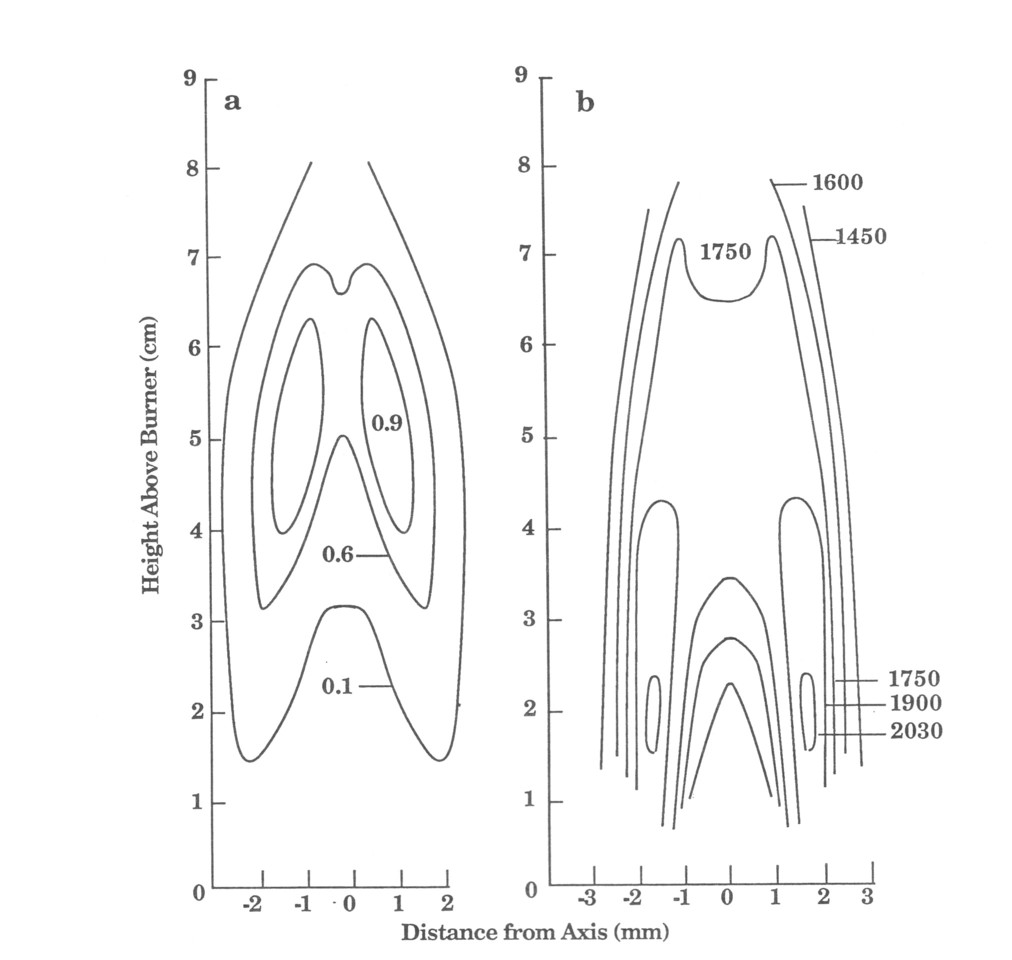
Figure 6. Comparison between the contour curves for a) Relative soot concentration (maximum concentration = 1), b) CO2 temperature (K). In the region of high soot concentration there are no high temperature gradients.
The spectral radiance can be measured, and given the Christiansen wavenumber νc, R (νc) can be used to determine temperature. Once the surface temperature is known, calculating є(ν) for all ν is also possible. Figure 7a shows that slag has its νc, at approximately 1200 cm-1. Figure 7b shows the spectral radiance of hot slag heated by a torch and the spectrum of a black-body that matches the radiance at 1200 cm-1. The temperature derived from curve fitting is 950 K while a thermocouple measurement on the slag surface is 973 K Figure 13c shows the є(ν) calculated for this slag sample. The estimated accuracy of the FT-IR temperature measurement is < 5 K (Fig. 7d). Since the Christiansen effect is so common, we anticipate extending this to many other applications.
Reflection spectra of thin films also contain valuable information on the optical properties of the film. The spectra yield information on composition, thickness, and morphology of the film.
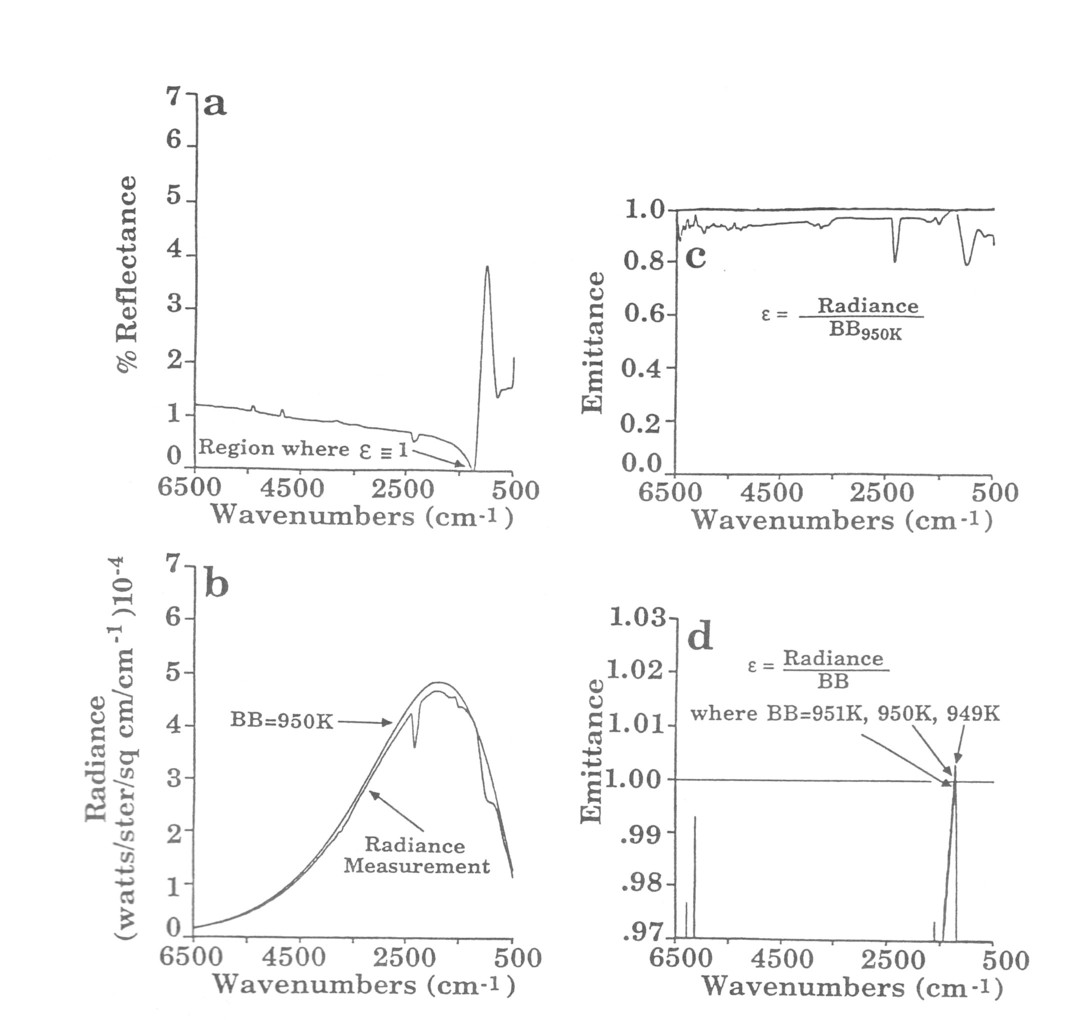
Figure 7. Surface temperature and spectral emittance from radiance measurement and zero reflection/transmission feature for slag from Babcock and Wilcox's Basic Combustion Test Unit, sample #5, internal smooth surface. a) Reflectance at the specular angle, b) Radiance overlaid with a 950 K theoretical black-body curve, c) Emittance = radiance/BB950K, d) Sensitivity of emittance calculation to + 1 K where = 1. A thermocouple bonded to the surface indicated a temperature of 973 K.
7. CONCLUSIONS
The above discussion is a description of the current capabilities FT-IR spectroscopy for monitoring combustion. Using a variety of optical configurations gas temperature and composition can be measured both relatively and absolutely in many cases. Particle size information can be obtained simultaneously. Tomographic reconstruction of multicord measurements can be used to give spatially resolved data. Combustion chamber wall temperature can be also be measured, or properties of thin-coating films. We anticipate that FT-IR spectroscopy capabilities will grow as further experimentation continues and spectrometer technologies improve.
8. ACKNOWLEDGEMENTS
This research was sponsored by a variety of grants under the Small Business Innovation Research government program. Sponsorship by DOE (DE-ACOI-88ER80561 and DE-AC01-85ER80320), NSF (ISI-8420911), and SDIO/IST (DASG60-88-C-0083) is gratefully acknowledged. The authors also wish to specifically thank Stanley Sobczynski, from the Department of Energy, for his support. Pierre Leroueil and Peter Thorn of Weyerhaeuser Paper Company also provided valuable help.
9. REFERENCES
SPIE Vol. 1434, Environmental Sensing and Combustion Diagnostics, p. 28-38, (1991)
1. R. M. Carangelo, P. R. Solomon, and D. J. Gerson, "Application of TG-FT-TR. to Study Hydrocarbon Structure and Kinetics," Fuel, 66, 960, (1987).
2. J. K Whelan, P. R. Solomon, D. G. Deshpande, and R. M. Carangelo, "Thermogravimetric Fourier Transform Infrared Spectroscopy (TG-FTIR)) of Petroleum Source Rocks," Energy and Fuels, 2, 65, (1988).
3. P. E. Best, R. M. Carangelo, J. R. Markham, and P. R. Solomon, "Extension of EmissionTransmission Technique to Particulate Samples Using FT-IR," Comb. Flame, 66, 47, (1986).
4. P. R. Solomon, P.E. Best, R.M. Carangelo, J.R. Markham, P-L Chien, "FT-IR Emission/Transmission Spectroscopy for In-Situ Combustion Diagnostics", 21st Symposium (Int) on Combustion, The Combustion Institute, Pittsburgh, PA, 1763, (1986).
5. P. R. Solomon, R. M. Carangelo, P. E. Best, J. R. Markham, and D. G. Hamblen, "Analysis of Particle Emittance, Composition, Size and Temperature by FT-IR Emission/Transmission Spectroscopy", Fuel, 66, 897, (1987).
6. P. R. Solomon, D. G. Hamblen, R. M. Carangelo, and J. L. Kraus, "Coal Thermal Decomposition in an Entrained Flow Reactor: Experiments and Theory," 19st Symposium (Int) on Combustion, The Combustion Institute, Pittsburgh, PA, 1139, (1982).
7. P. R. Solomon, and D. G. Hamblen, "Analysis of Coal Devolafilization in a Laboratory-Scale Entrained Flow Reactor," Electric Power Research Institute, EPRI AP-2603, July, (1983).
8. P. L. Hanst, "Pollution: Trace Gas Analysis" in Fourier Transform Infrared Spectr scopy, Vol. 2, J.R. Ferraro and L.J. Basile, Eds., Academic Press, San Diego, CA (1979).
9. C. F. Bohren, and D.R. Huffman, AbsoMtion and Scattering of Light by Small Particles John Wiley & Sons, (1983).
10. P. E. Best, P-L Chien, R.M. Carangelo, and P.R. Solomon, "Tomographic Reconstruction of FT-IR Emission and Transmission Spectra in a Sooting Laminar Diffusion Flame: Species Concentrations and Temperatures", Combust. Flame, published (1991).
11. R. J. Santoro, T.T. Yeh, J.J. Horvath, and H.G. Semedian, "The Transport and Growth of Soot Particles in Laminar Diffusion Flames", Comb. Sci. Technol., 53, 89, (1987).
12. L. R. Boedeker, and G.M. Dobbs, "CARS Temperature Measurements in Sooting, Laminar Diffusion Flames", Comb. Sci. Technol., 46, 301, (1986).
13. R. J. Santoro, J.G. Semerjian, and R.A. Dobbins, "Soot Particle Measurements in Diffusion Flames", Combust. Flame, 51, 203, (1983).
14. M. S. Landy, Y. Cohen, and G. Sperling, Computer Vision, Graphic and Image Processing 25, 33 1, (1984).