Flame Imaging Studies of Flame Development in a SI Four-Stroke Engine
S. C. Bates*
General Motors Research Laboratories, Warren, Michigan
*Engine Research Department
Abstract
The progressive stages of flame development in a spark-ignition (SI) four-stroke engine have been recorded in stereo flame luminosity images taken through a transparent liner and piston-top window. Flame evolution in each cycle is measured by superimposing early and later flame images.
Flame images are shown for the early, middle, and late stages of combustion. Image data are presented for three lean equivalence ratios, at 500 and 1000 rpm, and for one- and two-port intake, and average flame speeds are measured. The early flame kernel is shown to vary greatly in size, shape, and location, and this kernel is seen to have a major effect on combustion development by setting the basic flame shape throughout the cycle. The flame images permit various inferences to be drawn about the in-cylinder flow. Variable swirl from cycle to cycle, and a large scale cross-flow for one-port intake flow have major effects on flame growth.
Flame shapes are correlated with mass burn fraction curves derived from cylinder pressure histories. Mass burn history is found to be determined by the early flame kernel size and shape together with the large-scale midcycle flame shape and its interaction with the combustion chamber shape.
Introduction
The study of combustion in spark-ignition four-stroke engines has been going on for over a hundred years. Because of the difficulty of performing high-speed diagnostics, engine modeling and experiments have been based primarily on global variables and cycle-averaged quantities. Current trends,1 however, involve the use of advanced diagnostics to examine individual cycles or sets of cycles and how they affect overall engine performance.
Turbulent combustion in engines is a special case of both turbulence and combustion. The entire process takes place in a closed volume, with the piston as a rigid time-varying boundary that tends to drive the entire process at its own frequency. The turbulence in the cylinder decays after intake valve closing and is complicated by a variety of mean motions (swirl or tumble) and secondary flows that can be stable or unstable. All of these flows are affected by the time-varying volume; some in different ways than others. Furthermore, combustion characteristics that are deemed desirable can be quite different at different engine operating conditions, especially idle vs high speed.
As external constraints such as pollution controls and fuel economy standards increase, there is greater need for detailed understanding of combustion and improved design of the chamber. Answers may be supplied by optical diagnostics that can investigate the physical processes taking place in cylinder in each cycle.
Flame imaging in engines has been done for over 50 years.2 Its past use as a combustion diagnostic has been limited by restricted optical access and the many experimental inadequacies of using and analyzing film; these obstacles are now fading. In the work described here, light-amplified flame imaging in a realistic engine with nearly total optical access below the head3,4 provides a means for investigating the details of flame development and overall combustion behavior of the engine.
Equipment and Procedure
Since turbulent combustion in engines is dependent on many factors in unknown ways, as many engine and system parameters as possible should be specified to define adequately the physical context of the problem. Subtle details often have a major influence on combustion progress for some operating conditions.
Engine Characteristics
The flame image data of this work were taken from a single-cylinder visualization engine described in detail elsewhere.3,5 The major characteristics of this engine are
| Bore & stroke: 92.0 mm | Piston: Extended, Flat-topped |
| Connecting rod length: 191.6 mm | Fuel: Propane |
| Compression ratio, Cr: 9:1 | Spark: Duration 1.5 ms, Energy 75 mj |
| rpm: 4000 max | Head: Three-valve, pent-roof |
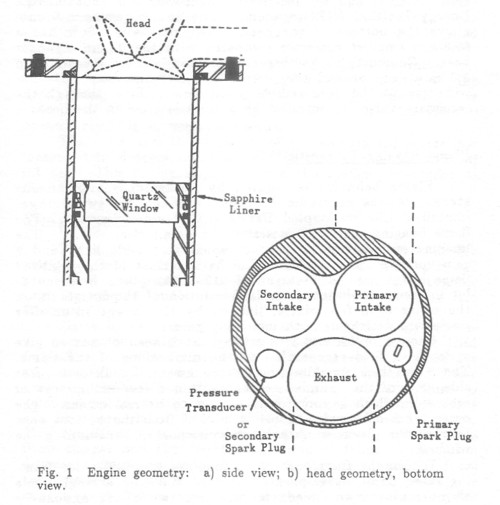
representative of a modern, four-stroke, spark-ignition internal-combustion engine. Global parameters for the engine are given in Table 1. The engine has a sapphire liner with a quartz piston-top window for optical access.
The engine is instrumented with a manifold absolute pressure (MAP) sensor, a piezoelectric cylinder pressure sensor, and a shaft angle encoder with 0.1-deg accuracy. Premixed propane and air fuels combustion for 50 cycles as the engine speed is held constant by a dynamometer.
Shown in Fig. 1a and 1b are the pent-roof head geometry and the transparent liner that extends to the bottom of the head. For the data presented in this work, the secondary spark plug has been replaced with a pressure transducer. The peripheral spark plug is oriented vertically (parallel to the cylinder axis) and is electrically driven by a standard High Energy Ignition (HEI) system. The spark gap is 8-9 mm above the bottom of the head. The piston window has a 69.8-mm smallest diameter compared with the 92-mm cylinder bore. Combustion chamber crevices consist of a 0.6-mm gap 5.0 mm deep around the piston, and a 3-mm-deep, 0.1-mm-wide gap at the bore radius in the head. Flow through the secondary valve is controlled by a throttle plate in the head.
Flame Imaging Diagnostic
Flame behavior is studied by analyzing instantaneous stereo images of flame luminosity taken by two image-intensified Charge-Coupled Device (CCD) video cameras. The flame imaging system is described in detail elsewhere.3,5 The imaging system has a linear response to visible light and a gain variable up to 10,000. The basic format of the digitized flame image data is an array of 512 x 512 pixels, with an 8-bit intensity resolution. Spatial resolution of the images is on the order of a few pixels, limited by the image intensifier resolution, decreasing with increasing gain.
Camera optics and lens settings have been chosen to give a depth of field comparable to the dimensions of the flame. The 5-mm-thick sapphire provides an essentially distortion-free side view of the chamber, except within a few millimeters of each side, which is compressed relative to its real extent. The outer 1 cm of cylinder radius is blocked from the bottom view through the piston window by the piston shell surrounding the window.
Within the framework of 30 frames/s standard video framing rates, flame development is recorded during a single cycle at normal engine speeds by making two short exposures separated in time on one frame. Single-image exposures as short as a few microseconds are obtained by gating the image intensifier. Since the flame front radiation is much greater than the comparatively uniform and weak radiation from the burned gases, the early and later images can be easily separated in most cases.
Experiment Operation
The flame imaging results reported here were taken from sets of firing runs. The engine first reaches a motoring equilibrium at the desired speed; then the tank containing a calibrated propane-air mixture is switched into the intake manifold line with a pair of valves, and the gas is drawn through the engine. The video recorders that store the flame imaging data are turned on before the run, and the computer is triggered to take 50 sequential cycles of pressure data at the start of the run. The intake tank is evacuated and refilled between runs.
Data were taken with both valves operating normally but with the secondary port throttled off at the entrance to the head, giving a mean swirl ratio of 1. Operation referred to as "two-port" differs from this only in that this throttle plate is opened, resulting in very little swirl.
The start and the duration of the camera exposures are measured in degrees crank-angle (deg-CA) to an accuracy of 0.1 deg. This timing is preset by a thumbwheel controller at the start of each run.
Data Processing
The engine cylinder pressure and liner temperature are monitored by an IBM PC/AT. Pressure data from each run are stored and postprocessed to give mass burned progress using techniques similar to those described in Rassweiler and Withrow2.
Flame images are analyzed by a commercial image processing package on a high-resolution (1024 x 1280), 256-color IBM PC/AT monitor. Simple contrast enhancement is used for maximum detection of intensity details in the processed flame image. Threshholding allows the location of the flame front to be found automatically from a series of images. Many images can be manipulated at one time as arrays fixed in space. This permits superposition of the engine geometry outline onto flame images and the direct comparison of flame images from different engine cycles. A graphics editor is used to form accurate line drawings from reference images, and these line images are added to the flame images of a sequence of cycles without any adjustment of their relative location.
Experimental Advances
A number of factors contribute to the ability to provide new data on flame development in engines.
Extensive optical access is the most important capability. Easy simultaneous stereo imaging gives a way to decipher the complex three-dimensional behavior of the flow and combustion in the cylinder.
Next, the use of video makes possible the screening of large amounts of data that reflect both the turbulent nature of combustion processes and the large number of interacting parameters that control engine operation. The speed and power of inexpensive image processing and personal computers then permit manipulation of a significant part of these data.
Digital imaging also provides accurate and repeatable analysis of data to place the images easily and accurately in their spatial context relative to a prerecorded fixed engine geometry and to explore image intensity distribution for structure and relative magnitude.
Finally, flame radiation amplification permits low-light-level lean and very lean flames to be examined, an important operating regime not readily available for study previously.
Flame Development Physics in SI Engines
A spark-ignition engine places the naturally complex process of turbulent combustion in a closed, time-varying volume, changing both the turbulence and the combustion. Combustion progress depends on the temporal and spatial interaction of many geometric, flow, chemical, and thermal parameters. Flame images give direct information about many of these processes, but some, such as flame chemistry, can be studied only indirectly.
One framework for examining flame development in an engine is to study the appropriate processes in the context of combustion progress regimes.4 These are: 1) spark initiation and very early flame kernel growth, 2) early flame kernel growth, 3) flame expansion, and 4) quasistationary combustion. Different physical effects are dominant in the different regimes, and these effects serve as a focus for exploring the dependence of flame development on the various parameters.
There are also dominant input and process variables that determine flame development in the engine. A flowchart of these variables is shown in Fig. 2. The blocks are arranged so that causality flows left to right as indicated by arrows. For example, the gas expansion component of the flame propagation velocity is fixed by the properties of the unburned mixture in front of the flame. Variables set externally during
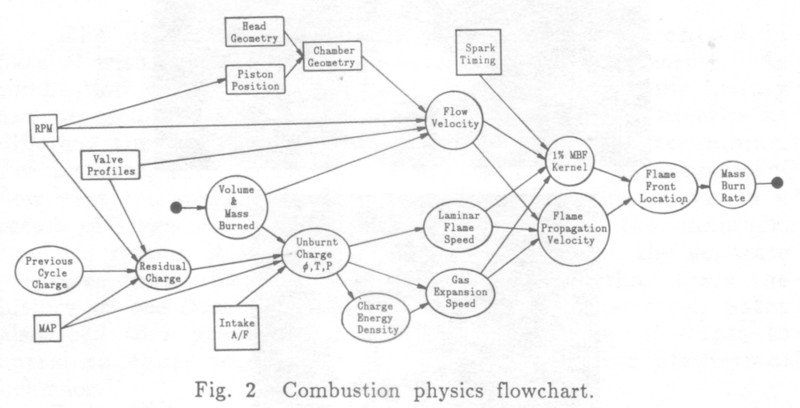
operation are indicated by squares, whereas engine geometry variables (more difficult to change) are shown as horizontal rectangles. Primary process variables that describe flame development during the cycle are indicated by circles. Dependent or subsidiary parameters that partially control the development of these engine variables are shown as ellipses.
Flame development is determined by the temporal and spatial history of the propagation velocity of the flame. The progress of the flame is measured in terms of the amount of mixture burned and described in terms of volume or mass. The propagation velocity has contributions from the gas expansion behind the flame, the laminar flame speed, the turbulent flame speed and, in the fixed reference frame of the engine cylinder, the convection of the flame by the large-scale flow. The complexity of the turbulent combustion arises from the interaction between all of these components.
The block diagram illustrates the physical processes by labeling the controlling parameters. The solid dot indicates where the process connects as a closed loop. The most important basic variables for flame development are the state of the unburned charge and the in-cylinder flowfield, in the context of the instantaneous combustion chamber geometry. Some parameters are shown because of the importance of their effect on flame development or because a single characteristic determines the flame behavior beyond a certain stage. An example of such a characteristic is the inclusion of a 1% mass burned fraction (MBF) flame kernel category. This kernel sets a critical junction for the future development of the flame and the combustion itself, as discussed later in this paper and in a previous work on cyclic variation.4
Two geometric effects dominate the behavior in this engine: the peripheral spark plug and the swirl that comes from the port configuration in use. The peripheral spark implies a long burn across the chamber and a flame geometry that is determined by only the side of the early flame kernel facing the center of the chamber. Also, swirl velocities are higher near the wall and larger relative to the flame speed so that, at this location the spark is more sensitive to swirl. The low swirl number for the configurations discussed in this work implies that the in-cylinder flow will, in general, contain variable large-scale motions rather than an overall rotation of the flow and flame from swirl.
An additional complexity that certainly exists in real engines is mixture nonuniformity. This has been eliminated in the present work by using premixed propane and air and will not be considered.
A velocity diagnostic has also been developed specifically for this engine to measure the in-cylinder flow. This diagnostic measures velocity by detecting the displacement of marked lines in the flow and is described in detail elsewhere.6 It has not been used in combination with firing experiments at this writing.
Flame Image Data
The data and discussion that follow are organized in parallel with the combustion progress regimes given earlier. As combustion proceeds from ignition to extinction, flame history can proceed along many paths. These paths can diverge at different times because of separate effects, or can recombine. For instance, a flame may initially grow rapidly as a result of flow past the spark plug during ignition, then slow down as a result of large-scale counterflow in the rest of the chamber. For this reason, it is more important to examine the separate processes that affect flame development rather than trace the history of one flame through one cycle. The interwoven paths also lead to a great deal of confusion when one attempts to correlate cause and effect using overall engine statistical behavior.
Individual samples have been chosen from a large number of engine tests to provide evidence of different effects. These results are examples representative of a type of behavior seen repeatably in the engine. The dispersion in flame development paths has been examined in a complementary paper on cyclic variation in this engine.4 This paper will be used as a reference for facts about flame development that have emerged from the study of entire sets of data.
It must be emphasized that the flame images represent line-of-sight integrals of the radiation from the flame. Thick flame fronts in the images do not necessarily imply a thick reaction zone. However, as the piston passes through the top-dead-center (TDC) position, the height of the chamber is much less than its width, forcing major variations in the mid- and late-cycle flame shape to be primarily radial rather than axial. This is not true of an engine flame in general; the early kernel, a different location of the spark plug, or a different combustion chamber shape will show three-dimensional flame growth.
Most of the flame images have line drawings of the engine derived from reference images that are superimposed onto the data appropriate to the camera view. For example, in views through the piston window such as Fig. 3b, the outer circle represents the cylinder bore, whereas the inner circle shows the extent of the actual image as defined by the piston window. At the top of the view through the window are shown the intake valves on one slope of the pent-roof and, at the bottom, the exhaust valve on the other slope. The position of the spark plug ground strap is shown by the outline at the lower right, with the electrode at its lower end. The protruding shape between the intake valves is the bottom flat of the head
protruding into the window view. The head pattern is identical to that given in the schematic of Fig. 1b.
Flame development in one cycle is examined by taking two short exposures during the interval of one video frame. As shown in the bottom view of Fig. 3b, the early exposure is the bright section around the spark plug, whereas the later exposure captures the flame halfway across the chamber. Behind the later flame, the burned-gas radiation is low and uniform, allowing the earlier flame image to be easily examined separately through image processing.
Spark and Early Flame Kernel
The beginning of turbulent combustion appears to be the most crucial of the stages of flame development.7,8 In this stage, the small laminar flame initiated by the spark becomes a fully turbulent flame.9,10 The basic physical process of interest is the interaction of the local flow with the flame.
For most current spark-ignition automotive engines (and the engine used in this work), combustion is initiated by a 1- 2-ms-duration, high-voltage inductive discharge across a spark gap flush-mounted in the cylinder head. The spark plug consists of a central electrode and a narrow ground strap welded at the circumference and ending just beyond the plug
axis. Many other methods of ignition exist and can result in very different flame development.
The important characteristics of spark ignition are its energy, duration, and geometry.9 It has been shown that the energy of the spark does not have a major impact on combustion if that energy is well beyond a known threshhold value9; current spark systems meet this requirement. Spark duration has effects on flame development that arise both from the total length of time that initiation energy exists and from the time that spark-flow interaction takes place. Spark-plug geometry is important with respect to its overall location in the chamber11,12 as the center of the expanding flame in the context of the whole combustion chamber shape. It is also important through the orientation of the ground strap, which can act as a flameholder or a flow obstruction, depending on the flow direction.
The spark itself varies significantly in location at the plug both from cycle to cycle and during the discharge, with smaller variations in duration and energy. Without flow, the spark moves around the full area of the electrode from cycle to cycle,4 resulting in important variations in the distance from the discharge to the ground strap base. This in turn causes a change in the interaction between the strap wake and flame propagation.
For flow velocities typical of current engines, flow through the gap often carries the low-inertia ionized gas column away from its original location to form a loop in the direction of the flow.4 Flow in the engine is such that these loops may occur during one spark, may be overextended so that the arc restrikes, or may not occur at all, depending on the local flow at the time of the spark. Thus, the ignition source for the flames is often varying in space and time.
The early flame kernel grows from the spark to become a fully turbulent flame. During this growth, it changes its smallest dimension by over a factor of 10, from a length comparable to the smallest turbulence scale to a length that begins to be a significant fraction of the cylinder bore. This growth is determined by the laminar flame speed and the flow in the vicinity of the flame. At the present time, changes in the early flame kernel are thought to account for most combustion variation between cycles in spark-ignition engine combustion.7,8 The three-dimensional shape and location of the early kernel are both important in this process.
The interaction of the flow and flame is most obvious at very lean mixtures, where the laminar flame speed is low enough so that the flame speed and flow speed are comparable. For properly phased combustion, these conditions in this engine are close to the misfire limit. Although misfires are a common and important engine phenomenon, they will not be considered here, where the emphasis is on flame development.
In an engine with low swirl (such as in this work), the flow at the spark plug at the time of the spark contains fine-scale turbulence and a series of larger-scale motions that are convective on the scale of the spark plug. The initial flame can grow while convective flows approach the plug in different directions of when there happens to be no convective flow at all.
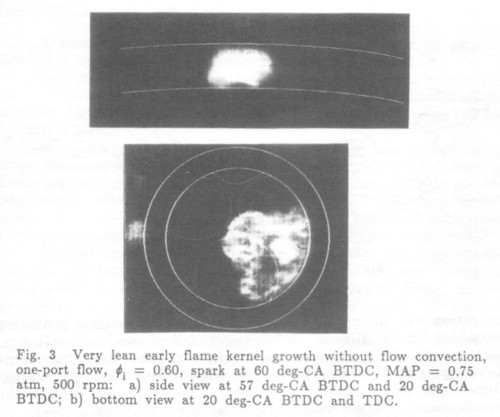
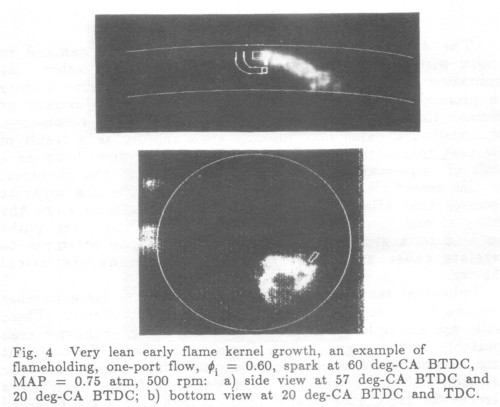
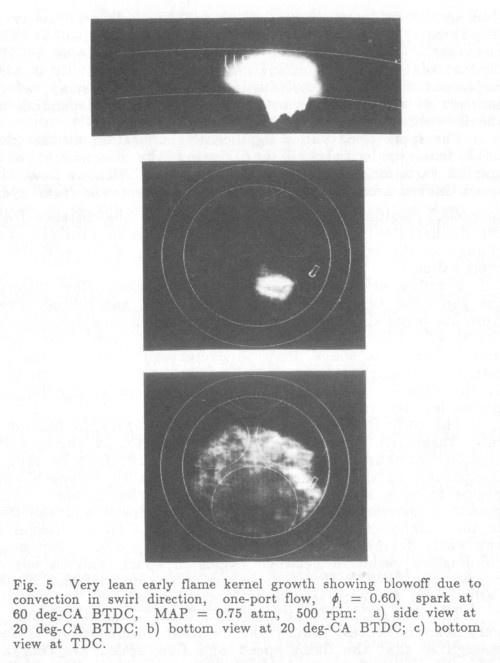
Figures 3-6 illustrate early flow-flame interaction. Data were taken at an intake equivalence ratio of approximately 0.6 with a spark initiated at 60 deg-CA before TDC (BTDC). The manifold absolute pressure (MAP) was 0.75 atm at 500 rpm with one-port flow. The equivalence ratio is not constant from cycle to cycle because of varying amounts of residual fraction after partial burns or misfires. Slant side-view exposures were taken at 57 deg-CA BTDC for a duration of 0.1 deg-CA and at 20 deg-CA BTDC for a duration of 2.0 deg-CA, whereas bottom-view exposures were taken at 20 deg-CA BTDC for a duration of 2.0 deg-CA and at TDC for a duration of 1.0 deg-CA. The earlier image in the slant side view shows the spark at approximately the middle of its duration.
Orientation of the spark plug is indicated by the outline of the ground strap in each bottom view; the plug was inserted so that the open end of the strap is at the lower end in the images. Since the spark is 1.5 ms long, it lasts for approximately 4.5 deg-ca CA at 500 rpm. The flame images have been enhanced for maximum contrast, and the background cylinder patterns have been superimposed. The bottom line in the side view indicates piston position at 20 deg-CA BTDC.
The case of minimal convective flow is shown in Fig. 3a and 3b. The first exposures in both views show the early kernel to be localized at the spark plug and expanding from there. Some flow at a later time is indicated by the distorted flame shape at TDC in Fig. 3b. As expected, this case is the exception; there is usually a convection flow of some sort at the plug.
Figures 4a and 4b show a case in which the convective flow is aligned with the ground strap. Here the flame is able to propagate back into the stagnation region behind the ground strap connection, which then acts as a flameholder. The flame is shown stretching out from the plug, with the flow as continuous light from the spark to the piston top, expanding sidewise at the local turbulent flame speed. At higher flow velocities (high swirl), the few-millisecond spark permits continuous flame ignition and a similar extended flame.13
Two different degrees of crossflow are seen in Figs. 5 and 6. Partial crossflow is shown in Figs. 5a-5c, where the early flame kernel has blown off the spark plug into a region of low turbulence so that initially it grows slowly. Later, at TDC, the flame area is much larger than the other examples because of the higher equivalence ratio in this cycle. The richer mixture is also the cause of the saturated exposure in Fig. 5a. For this type of camera, image saturation causes vertical
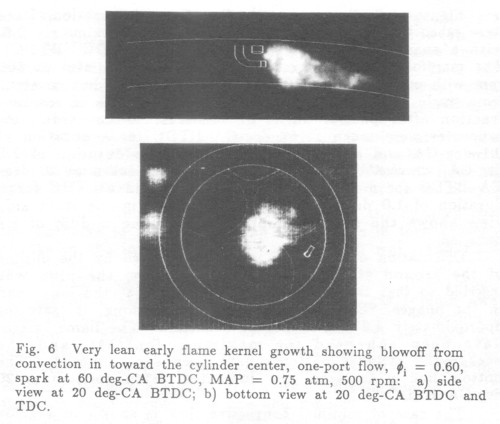
blooming, - the white area extending below the piston line. The bottom view exposures of Figs. 5b and 5c happened to fall on separate video frames. Figures 6a and 6b show a case in which the crossflow is at nearly a right angle to the ground strap, leading to a growing kernel at the center of the chamber. The spark in not shown in Fig. 6a.
The effect of the flow on frame development decreases as the equivalence ratio increases, but it remains important. As the mixture becomes progressively richer, both the laminar flame speed and gas expansion speed increase, while the
contribution of turbulence remains the same. To explore this dependence, data are presented at successively richer mixtures.
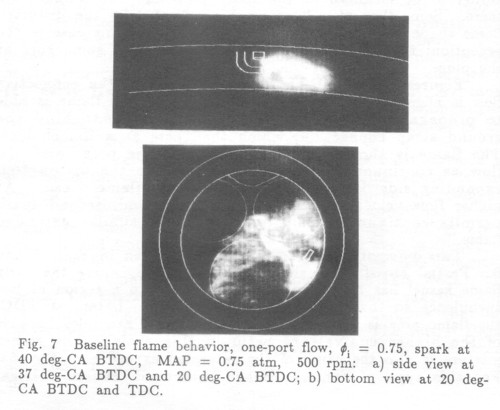
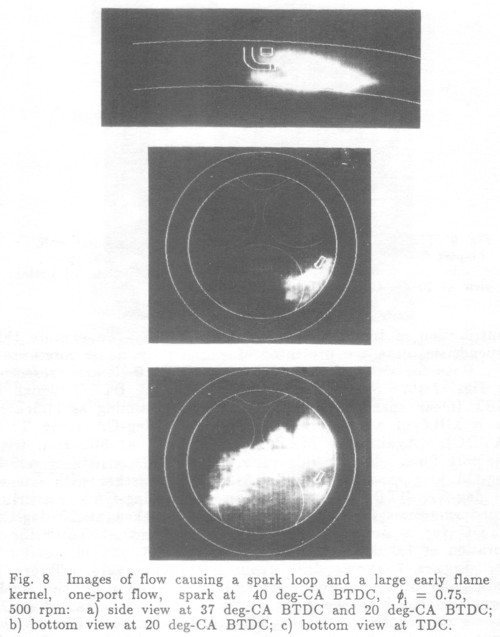
Data for an intake equivalence ratio of 0.75 are presented in Figs. 7-10. Spark timing was 40 deg-CA BTDC, which is MBT (mean spark advance for best torque) timing as indicated by a MBF of approximately 60% at 10 deg-CA after TDC (ATDC). Again, the MAP was 0.75 atm at 500 rpm with one-port flow. In the side view, the image consists of a 0.1 deg-CA long exposure 37 deg-CA BTDC, together with one at 20 deg-CA BTDC for a duration of 2.0 deg-CA. Superimposed exposures for the bottom view were taken at 20 deg-CA BTDC for a duration of 2.0 deg-CA and at TDC for a duration of 1.0 deg-CA.
Figure 7 shows data from a typical cycle. There is indication of some clockwise swirl, as shown by the early kernel displaced to the right of the plug in Fig. 7a. Fig.7b shows continuing swirl at TDC from the rotation of the burned region with respect to the spark plug. This is
contrasted with the data of Fig. 8, where there is a much greater swirl at the time of the spark. The spark is blown out into a loop, as discussed earlier, and the flame is elongated as the spark plug apparently acts as a flame-holder to generate a much larger flame kernel in the same interval as the flame in Fig. 7.
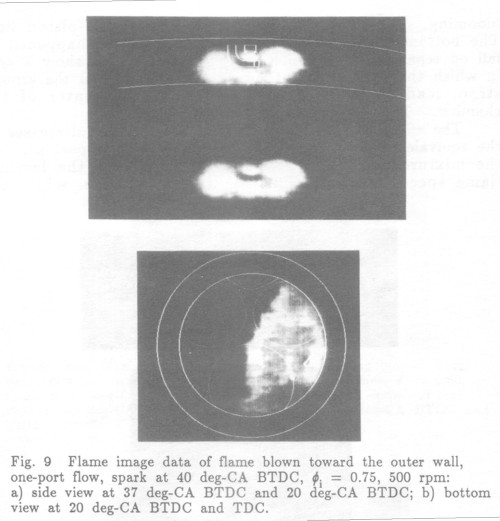
Figure 9 shows a much more unusual case, in which the flame kernel has been blown toward the wall. Figure 9a shows the same side view of the early flame kernel with and without the line drawing, to emphasize the shadow cast by the ground strap. This shadow indicates that the flame is behind
the strap and between it and the wall. For a delayed spark and consequently decreased clearance height at the time of spark, this location of the early flame kernel leads to a delay in flame propagation as the flame goes past the ground strap again and to a distortion in the flame throughout the cycle.
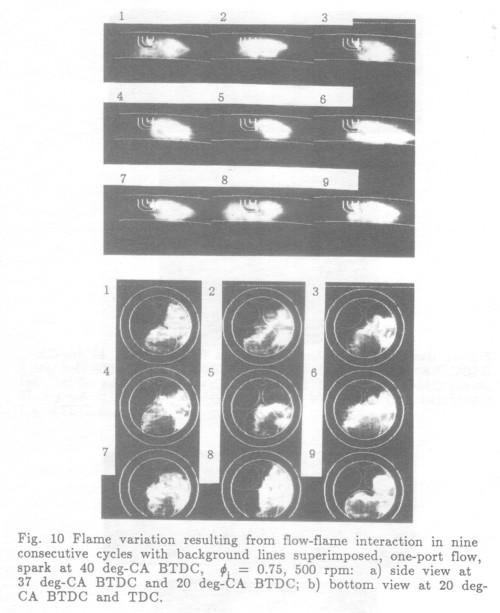
A set of flame images from nine consecutive cycles from this one-port run is shown in Fig. 10 to indicate the typical shape, location, and structure of the flames. The data of Figs. 7-9 are taken from cycles 16, 18, and 20, respectively. Most of the cycles show the expected average swirl, seen as the rotation of the apparent center of flame expansion in the early and later bottom-view images.
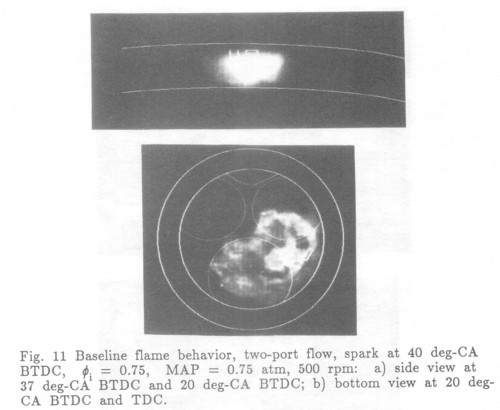
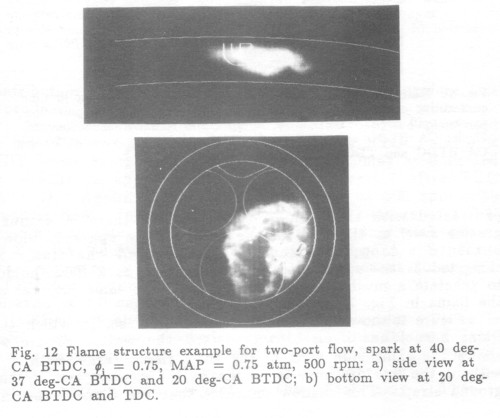
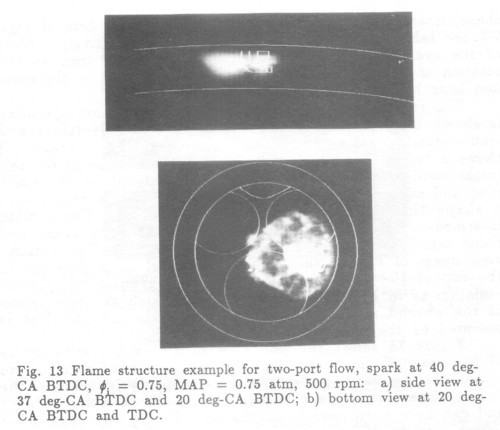
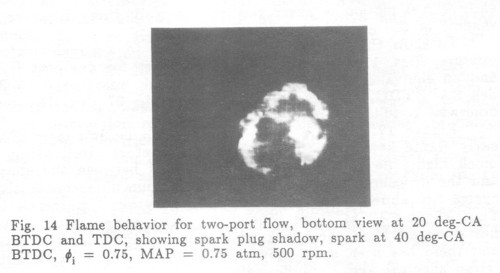
The range of early kernel behavior for two-port operation is shown in Figs. 11-16 with the same camera settings and lean engine operating conditions as in Figs. 7-9. Figure 11 shows a typical case characteristic of the lack of swirl for this intake configuration; the early kernel is centered on the spark plug and expands from there. Figure 12a shows a kernel with a shape that indicates the interaction of the flame with intermediate-scale turbulence. Figure 13a shows a spark and flame kernel blown back into the ground strap. The bottom-view image of Fig. 14 shows that the kernel often develops in the top of the head, not obscuring the ground strap with radiation as in Fig. 11b. A similar dark area at the location of the ground strap is shown in Figs. 12b and 13b but is obscured by the lines indicating the strap.
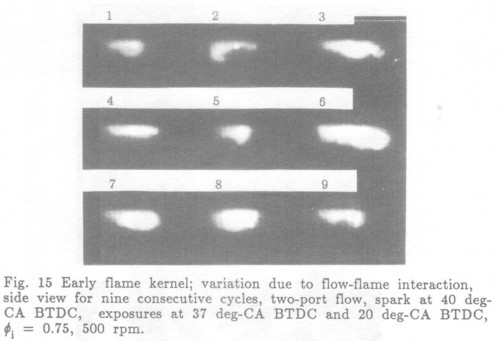
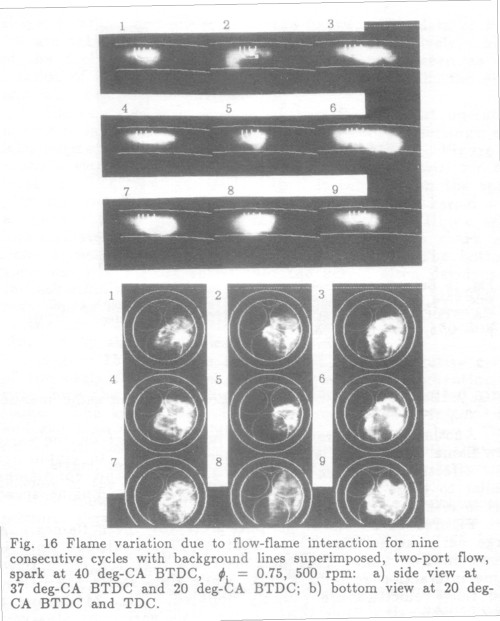
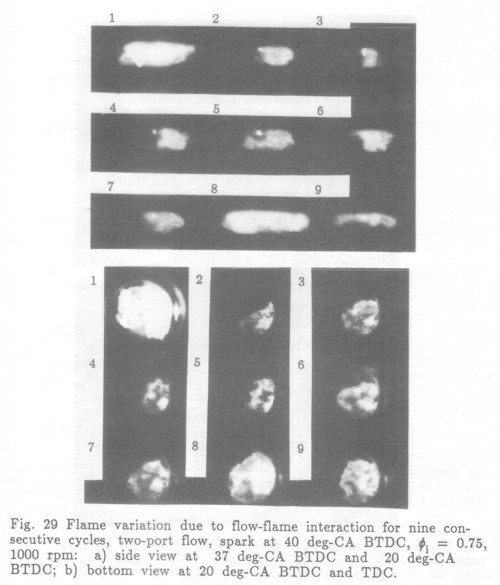
Figure 15 shows the side view of nine consecutive cycles of the early flame kernel for the two-port configuration to show how the varying flow from cycle to cycle changes the flame. The kernels vary in size by more than a factor of 2 and can have very convoluted shapes. Figure 16 shows these flames with background patterns superimposed. Note that the early kernel motion is never toward the wall; there is never a shadow of the ground strap.
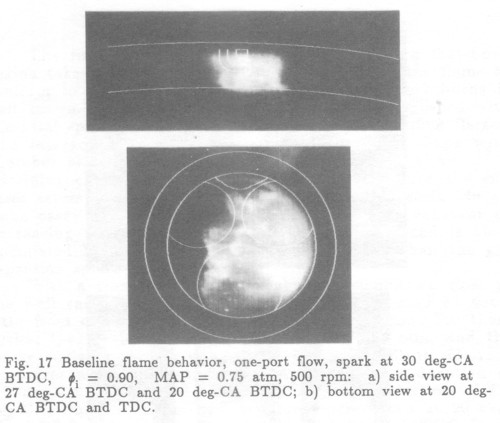
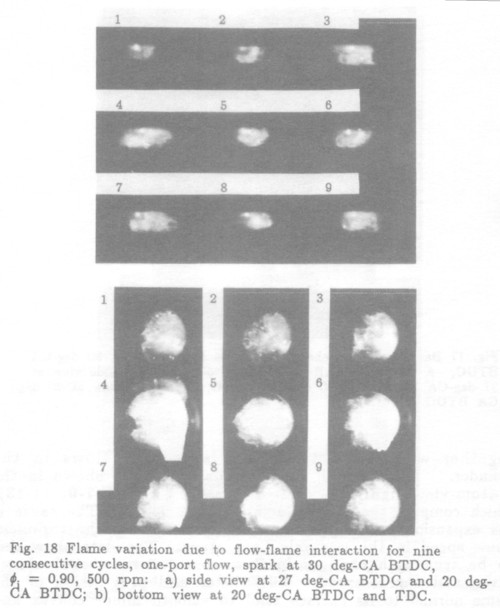
To show the behavior of flames closer to a stoichiometric mixture, Figs. 17 and 18 show flame images for one-port flow and an equivalence ratio of 0.90. The spark was moved to 30 deg-CA BTDC, and the spark exposure to 27 deg-CA, but otherwise conditions are the same as before.
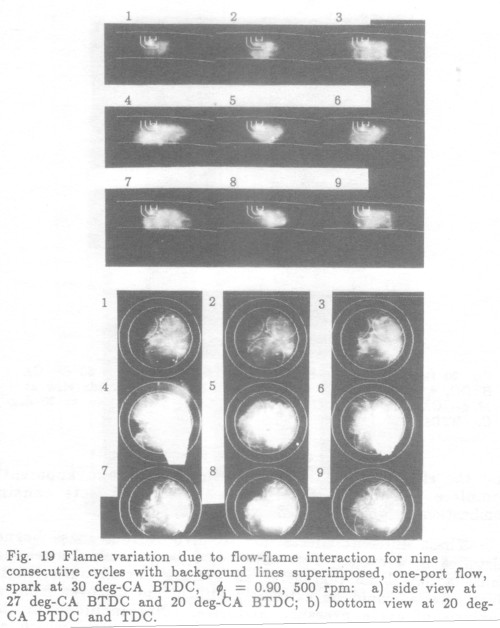
Figure 17 shows a typical pair of flame images. The early flame kernel is the same size as before, indicating a much higher flame speed since the interval between the spark and the exposure has been halved. The same nine consecutive cycles are shown with and without background patterns in Figs. 18 and 19 at these conditions. The early kernel shape has diverged from the spark with minor shape perturbations, and there has been some movement of the center both radially (strap shadow) and circumferentially.
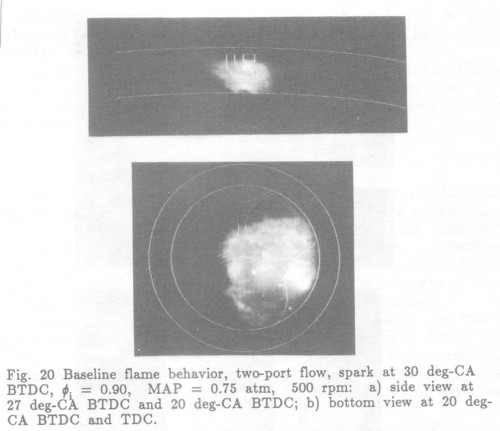
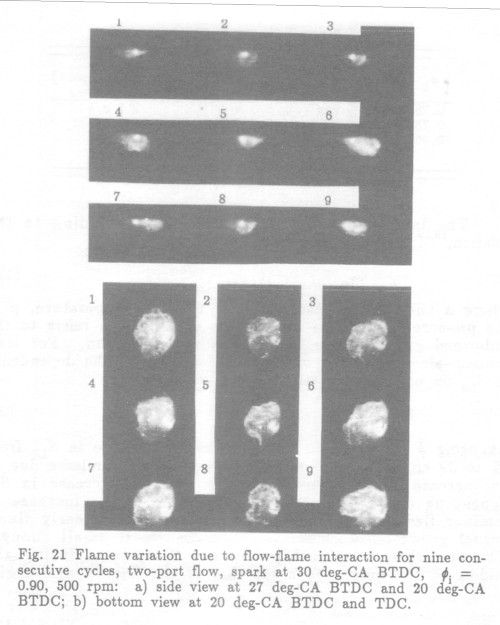
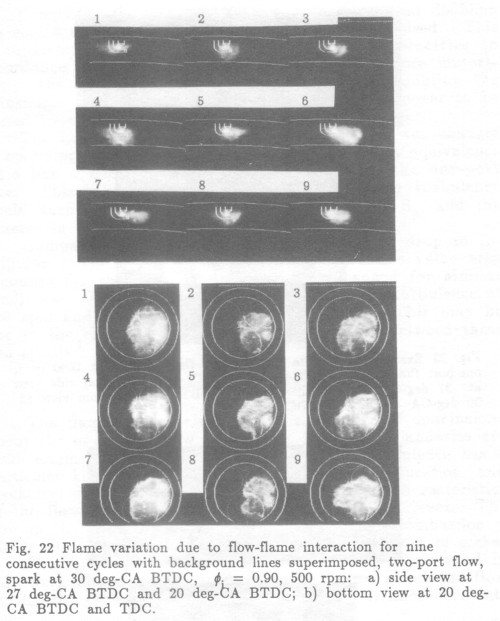
Figures 20-22 show flame image data for two-port intake flow for øi = 0.90, while other parameters remain the same. Although a typical flame, as shown in Fig. 20, is very similar to the one-port case, the consecutive cycle images of Figs. 21a and 22a show a greater variation in flame location, shape, and size. These early flame kernels have not grown axially enough to eliminate the shadow of the ground strap, as in the
early bottom-view exposures in Fig. 21b, in the same manner as the ø = 0.75 data.
Another major parameter that has an impact on the early flow-flame interaction is engine speed. Again, to emphasize flow effects, data were taken at ø = 0.75 and conditions similar to those giving the data on Figs. 7-10. Engine speed was increased from 500 to 1000 rpm.
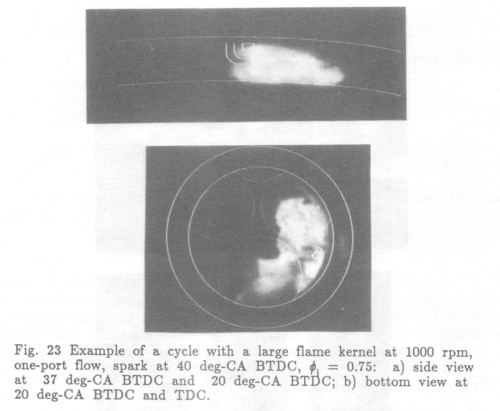
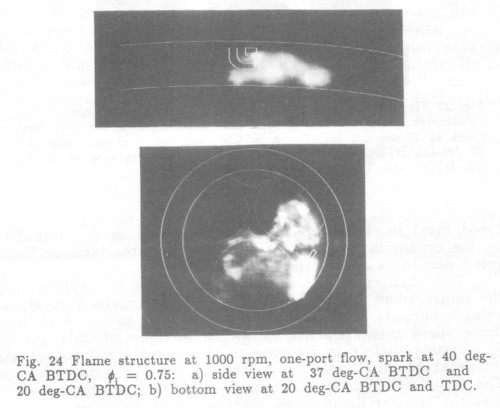
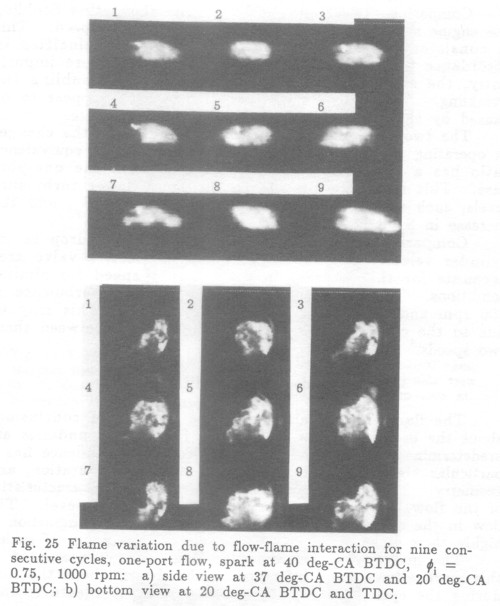
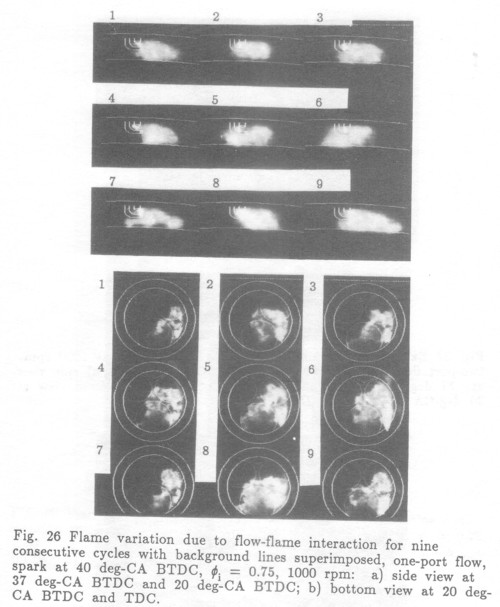
Figures 23-26 show one-port data for these flames. A large early kernel similar to that of Fig. 8 at 500 rpm is shown in Fig. 23a. This demonstrates that the early flow-flame interaction remains similar while time scales are halved and flow velocities are roughly doubled. Fig 24a shows a case in which the flame image shows scale variations also very similar to those at 500 rpm. The consecutive cycle images shown in Figs. 25 and 26 confirm the similarity.
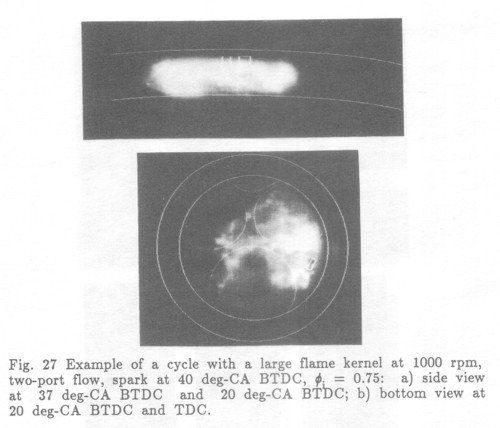
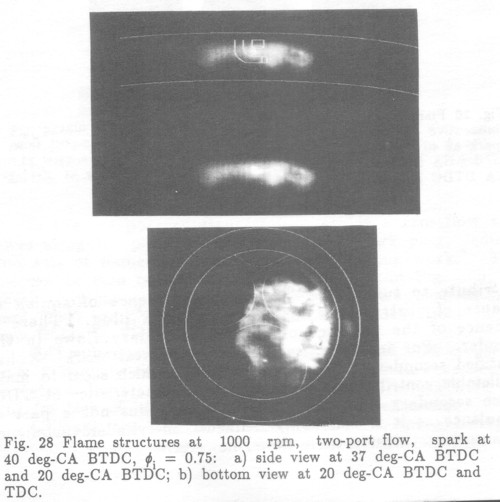
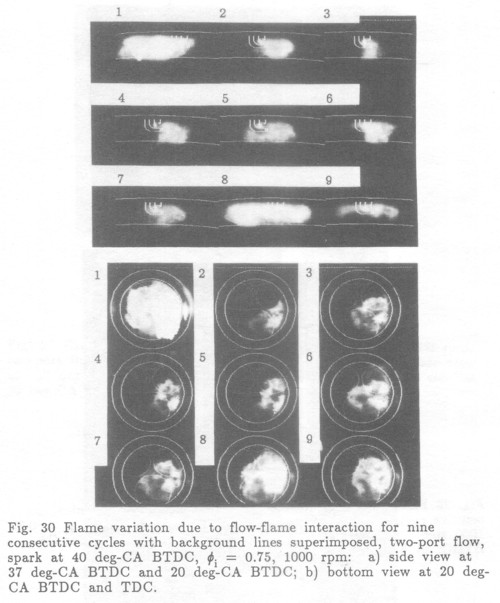
Figures 27-30 show the same similarity of behavior at different engine speeds for the two-port configuration. A large early kernel is shown in Fig. 27a, and Fig. 28a shows kernel scales at 1000 rpm. Consecutive cycle images shown in Figs. 29 and 30 again show the basic similarity of the images at the different speeds.
Midcycle Burn
The midcycle burn stage includes most of the volume burned in the cylinder, while much of the mass remains unburned near the wall. The flame image data taken at TDC
represents only 20-40% mass burned, depending on the equivalence ratio. This burn stage includes the major interactions between the flame and the combustion chamber shape, as well as between the flame and flows that are on the scale of the cylinder size.
The primary characteristic of the midcycle burn is the shape of the flame front. This shape has a mean large-scale curvature with superimposed convolutions representative of turbulence of progressively smaller scale down to the Kolmogorov length scale.
The mean large-scale curvature of the flame is set by the shape of the side of the early kernel facing the chamber,
together with interaction with large-scale flows in the cylinder.3,4 This overall shape similarity is also shown in the bottom-view figures presented here (e.g. Figs 7-9, 11-13), which compare the early and later flame shapes. The cause is gas expansion behind the flame, which dominates the turbulent flame speed in the midcycle burn stage. The date show this to be true with changes in flow configuration, equivalence ratio, and engine speed. Turbulence and progression of the flame normal to its surface tend to smooth minor convex and concave distortion in the flame front.
The large-scale midcycle flame shapes are characteristic of the intake configuration. As discussed in the previous work on cyclic variation4 and seen again in the data here in Fig. 10b, the one-port configuration flames are round, indented, or of an intermediate shape. The two-port flames are basically round (Fig. 16b) but often elongated along the pent-roof axis (Fig. 16, cycle 1).
Much structure can be seen in the light intensity variations in all of the TDC bottom-view exposures in this work, characteristic of the flow in each cycle. The bright and dark patterns arise from varying orientation of the flame front. A front aligned with the camera direction appears bright relative to a front normal to the camera view, giving much detailed flame front geometry information.
Overall rotation of the flame relative to the spark plug is indicative of swirl in the cycle. The one-port swirl number of 1 and the lack of swirl in the two-port configuration are shown consistently in the data. There is considerable variation in swirl from cycle to cycle, however.4 This variable swirl is often the cause of the variations in the size of the early flame kernel; Fig. 8a shows a longer kernel in the swirl direction, and Fig. 8b shows continued rotation of the flame in the clockwise direction.
Combustion Completion
The final stage of combustion in a modern fast-burn engine takes place near the wall. The need for the flame to conform to the combustion chamber to achiever fast burns is well known.11,14 This conformity is usually accomplished with a central spark plug and assumes spherically expanding flames. The interaction of variable flame location and shape with chamber shape to give extended burns is also known.15,16 Two-plug chambers or less efficient chambers burn the end gases across a volume rather than through a thin shell. In all these cases, much of the mass burned occurs at constant or decreasing pressure. The flame propagation speed is then dominated by the turbulent flame speed rather than the gas expansion speed.
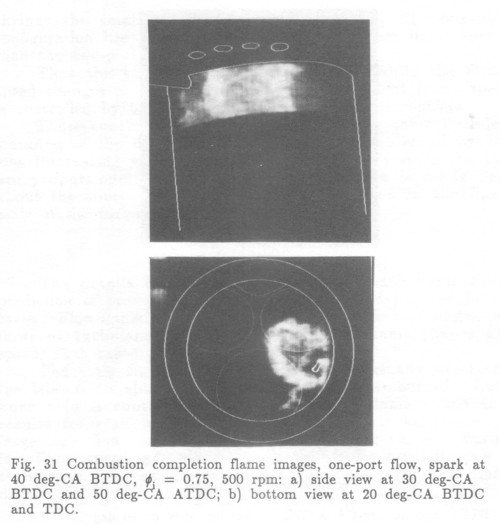
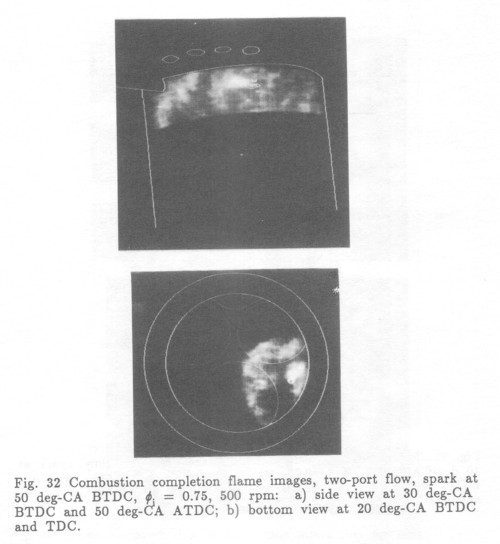
With a transparent liner, combustion completion close to the wall can be directly examined. Figures 31 and 32 show datta from one-port and two-port lean firing runs. For these cycles, the manifold absolute pressure was 0.75 atm, and the intake equivalence ratio was 0.70 at 500 rpm. Slant side-view exposures were taken at 30 deg-CA BTDC for a duration of 2.0 deg-CA and at 50 deg-CA ATDC for a duration of 1.5 deg-CA, whereas bottom-view exposures were taken at 20 deg-CA BTDC for a duration of 2.0 deg-CA and at TDC for a duration of 1.0 deg-CA. The upper left corner of the view through the liner is blocked by a surface temperature probe, indicated by the superimposed lines. Spark timing was 40 deg-CA BTDC for the one-port configuration, and 50 deg-CA BTDC for the two-port configuration. The images have been enchanced for maximum contrast and have had the background cylinder patterns superimposed. The line drawing in the side view indicates piston position at 50 deg-CA ATDC.
As discussed elsewhere, the flame variation characteristic of operation at 500 rpm in this engine is shown in the bottom-view images. Combustion in cycles for the two-port case often result in partial burns resulting from the slow flame propagation rate.
The side-view images of combustion in each cycle show the location of continuing combustion at the wall. Fully burned regions result in uniform intensity, whereas radiation from the burning turbulent flame gives regions of highly structured intensity. The faint striations aligned with the piston-top line are caused by compression ring debris on the inner wall.
Figure 31b shows combustion completion for the one-port configuration, whereas Fig. 32b shows the same for the two-port case. These cycles were chosen for the extensive burning along the wall that shows flame structure. It is notable that the intensity structure shown in Figs. 31b and 32b is very similar. This is true for other cycles as well. These flame fronts are also almost all vertical.4
Almost all of the side-view images indicate that the flame front is vertical, supporting the earlier assumption that the bottom-view images are good representations of flame shape, even though they are axial averages.
Mass Burned Development
Mass burned history is the usual measure of combustion progress in an engine. However, both mass burned and pressure increase are integral parameters that result from the combined details of flame development in the cycle. Although these integral quantities are the measurable outputs of the process, and those most important for the engine, the fundamental process of interest is the flame development.
Flame areas have often been used to compute mass burned fractions (MBF), which can also be derived from the cylinder pressure.2,15 Burning progress itself has been classified into various intervals. The interval of 0-1% MBF is classically known as ignition delay,17 whereas 10-90% has been used as an indicator of primary combustion rate.17
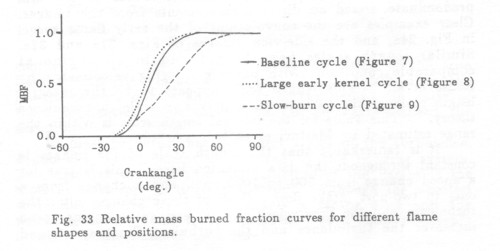
In the previous work,4 which classified the MBF curves relative to an average at 1%, 50%, and 90%, correlations were found between flame shape and mass burned rate. Fast early burns (short ignition delay) were found to correlate with large, very early kernels (before significant mass burned). Slower midcycle burns were found to correlate with flames that are flat on the average, relative to round flame fronts. The large-scale shape was found to explain MBF changes between cycles at one intake configuration and speed, even though changes in smaller-scale turbulence might be expected to have a major effect. This is consistent with the turbulence discussion that follows, showing that the intermediate scales do not change between cycles or even between operating conditions.
Mass burned fraction curves for the flames shown in Figs. 7-9 are presented in Fig. 33. The cycle in Fig. 7 is an average burn, whereas that shown in Fig. 8 is a fast early burn caused by the large early kernel, as shown in Fig. 8a.
The cycle shown in Fig. 9 and its corresponding MBF curve represent an unusually slow burn. This appears to be due to series of effects. First, the spark-plug structure delays the fame that must pass it after having been blown toward the wall. The initial kernel also begins on the axis of the pent-roof and expands along this axis, as indicated by Fig. 9b. Most of the early kernels expand from the side of the pent-roof as a result of the swirl, so that expansion stretches
the kernel relative to one in the center. The difference is one of a kernel expanding into either a contracting or expanding chamber. An expanding chamber volume accelerates growth by enlarging the flame surface. The case in Fig. 9 will be relatively slow because of this effect. Other more important lengthening effects on combusion are the flat flame front and the poor match of the flame shape to the chamber shape. All these effects combine to give a very slow mass burned, as indicated in Fig. 33.
Together, the effects just discussed explain all of the major divergences of the MBF from the average cycle, in a set of cycles. Adding the in-cylinder flow effects discussed later
and the effects of partial burns and misfires, an apparently complete picture is created of the major effects causing combustion progress in this engine.
These different effects mix to give various mass burned histories in a cycle. For instance, a large early kernel may cause a flat flame that gives an average overall burn length. Such effects would be extremely difficult to discover from an analysis of cycle pressure histories. Not included in this discussion are the effects of high swirl, or squish, which are not present in this engine. However, from the nature of the effects described here, high swirl and squish could be included through their effects on the phenomena already discussed. A more complicated effect also not considered is mixture nonuniformity.
Flame Speed Analysis
Flame speeds vary significantly for the operating conditions discussed previously. The flame propagation speed Sp increases in proportion to engine speed and turbulence level. Although the images presented capture the flame front at widely separated times, some useful flame speed calculations
can be made taking advantage of similarity in shape of the early and later flame kernels. This shape similarity permits approximate location of the same point in the flame front for the separate images and, therefore, measurement of its average displacement. Dividing by the appropriate time interval gives an average flame propagation speed.
Calibrating for image scale gives the results listed in Table 2. The measurements in Table 2 are averages from multiple points along the flame front in each image. They are approximately constant for an entire run and are accurate to 10-20% They apply to only the middle portion of the burn.
The flame propagation speed has contributions from the laminar flame speed SL, the gas expansion speed Se, and the turbulent flame speed St.
| øi | Speed | Sp (one-port) | Sp (two-port) |
|---|---|---|---|
| 0.75 | 500 rpm | 5.3 m/s | 2.5 m/s |
| 0.75 | 1000 | 8.7 | 6.1 |
| 0.90 | 500 | 5.6 | 4.6 |
The laminar flame speed SL changes according to the relation,18,19
SL = SLø(Tu/Tø)α (p/pø)β (1-2.1f) (1)
where α and β are constants, T is the gas temperature, p is the pressure, 0 refers to atmospheric conditions, u refers to the unburned gas, and f is the diluent mass fraction. For lean propane-air mixtures, α = 2.2 and β = -0.23. The dependence of SLø on equivalence ration (ø) is given by
SLø = 38.31 + 24.81(ø - 1) - 153(ø - 1)2 (2)
Changing ø from 0.70 to 0.90 implies an increase in SL0 from 32 to 39 cm/s, or 20%, and the larger pressure release due to an increase in fuel density implies a large increase in SL, depending on the time during the cycle. The increase in laminar flame speed is most important during early flame kernel growth and if the turbulence level is small enough. The empirical relationship between St and SL during the middle of the burn11 as a function of the fluctuation velocity u' is
St = SL + 4u' (3)
The gas expansion velocity results from the density decrease from the reactants to the products. It represents an amplification factor of local flame speed, since it is proportional to the mass entrained by the local flame front throughout the flame. Se is reduced as the cycle progresses by increasing resistance from the compressed end gases.
The importance of SL for the early flame kernel is shown by the fact that the images show that the flame kernels at 20 deg-CA BTDC are the same size for the ø = 0.90 cases although the time between the spark and the image has decreased from 20 deg-CA to 10 deg-CA. Since the turbulence is unchanged, the implied doubling of early flame
speed must be due primarily to the increase in SL, amplified by the expansion velocity. It is known that the laminar flame speed dominates early flame kernel growth.9
The changes in the one-port results can be explained by the contributions from St and Se during the main part of the volume burned. Comparing the ø = 0.75 to the ø = 0.90 flame speed measurements shows an increase of only 5-10%. Se increases slightly in response to the increase in product gas temperature and appears to account for the small change. The turbulence remains unchanged at a large enough value to that the laminar flame speed contribution is not important.
Comparing the 500- to 1000-rpm data shows that doubling the engine speed almost doubles the propagation speed. This is consistent with an increase in turbulent velocities in accordance with the dependence of St on u'. More importantly, the smallest turbulence scale is halved, doubling the wrinkling. As will be shown later, changes in St appear to be caused by changes in the smallest scales of turbulence.
The two-port data display similar trends over the changes in operating parameters. However, the increase in equivalence ratio has a much larger effect compared with the one-port case. This is apparently due to the much lower turbulence levels, such that SL forms a major part of the Sp, and the increase in SL is reflected in Sp.
Comparing the one- and two-port cases, the drop in in-cylinder velocity due to the increase in effective valve area accounts for the decrease in propagation speed for similar conditions. The data imply a larger decrease in turbulence at 500 rpm and a smaller decrease at 1000 rpm. This may be due to the change in large-scale flow structure between these two speeds.4
In-Cylinder Flow Implications
The flame images also lead to a number of conclusions about the in-cylinder flow. For this flow, the boundaries are predetermined, if not fixed, and the decaying turbulence has a particular kind of initiation in terms of energy, duration, and geometry. These constraints lead to repeatable characteristics of the flow, such as mean swirl and turbulence level. The flow in the cylinder that contributes to turbulent combustion is highly three-dimensional and varies over a wide range of scales.
The intensity structure of the flame images presented in this work allows some inferences to be drawn about the flow during the cycle, even though no flow velocity measurements have been made yet.
Large-Scale Flows
The large-scale flow in this engine apparently consists of swirl that varies from cycle to cycle and a central crossflow for the one-port configuration.
Swirl is inferred from the overall rotation of the flame front, shown in the bottom-view images. It is quite variable, an apparent consequence of a major secondary flow instability in the intake process for both the one- and two-port cases. The average swirl number implied by the data is consistent with independent engine measurements, a swirl number of 1 ro one-port flow and 0 for the two-port intake.
In the one-port configuration, there is a crossflow that moves along the pent-roof axis toward the spark plug, deduced from sets of flame-front curves in the previous work.4 This flow can be seen most prominently in cycle 9 in Fig. 10b. It occurs only in some cycles and seems to disappear at high speed (1000 rpm),4 as shown by a lack of indentation in the flame fronts in Fig. 25b.
The existence of both the variable swirl and crossflow imply a strongly varying effect of the directed flow caused by the intake ducts. The crossflow does not correlate with the swirl (or lack of it)4 but may be a related phenomenon.
Although the flow is definitely turbulent, the meaning of turbulence is not clear. Swirl is a mean motion that can
contribute to turbulence through the presence of squish or because of obstructions such as the spark plug. There is evidence of the presence of various secondary flows in the cylinder. For instance, current experimental work20,21 has identified secondary flows called "tumble", which seem to make predictable contributions to turbulence characteristics at TDC. These secondary flows are repeatable and thus not a part of turbulence as it is commonly defined. In-cylinder turbulence measurements include these flows, however.
Turbulence
The structure of the brightness variation in the images at the flame front arises from the detailed shape of the flame. The flame is assumed to be thin and convoluted by the flow.22 These convolutions are in turn a result of the local turbulent flow.
Since the cameras integrate flame radiation along a line of sight, the convolutions of a flame front parallel to the viewing axis will be superimposed, whereas a flame normal to that axis will be more distance. For the early flame kernel images, the front and rear are superimposed, and any deep convolutions that make the flame front double-valued will also create
confusion in the image. The clearest indication of the true flame convolution is shown in Figs. 31b and 32b since the images capture only a single layer of the flame. In spite of these deficiencies, some conclusions can be reached about the turbulence.
It must be noted that the finest scales of the turbulence, 1 mm and below, cannot be resolved by this imaging system. This explains the fact that the structure of the flames is the same at 1000 rpm as it is at 500 rpm. Although the smallest scale has shrunk by approximately a factor of 2 and the wrinkling of the flame front increased,22 both these scales are invisible to the cameras used here.
Throughout the image data, both for the early flame kernels and the later flames, shapes of scale of 4-5 mm predominate, based on direct measurements from the images. Clear examples are the convolutions of the early flame kernel in Fig. 24a, and the side-view images of Figs. 31a and 32a. similar length scales have been found to an engine at comparable conditions with particle imaging velocimetry by Reuss et al.23 This length scale appears to be the integral length scale of the turbulence, a pervasive scale in turbulence theory.24 This value for the integral length scale is within the range estimated by Mattavi et al.11
It is remarkable that the length scale of the images is constant throughout the data presented here. This is true for a speed change from 500 to 1000 rpm, and a change from a one- to two-port intake flow. Both of these changes alter the turbulence and the flow velocities. Increasing the engine speed increases the turbulence and the turbulent flame speed and
shrinks the smallest turbulent length scale. The one-port configuration has higher flow velocities and higher flame speeds than the two-port case.
That the visible scales remain similar while the flame speed changes so much implies that the turbulent flame speed is controlled by only the smallest scales of the turbulence.
These conclusions are consistent with the current understanding of the dependence of turbulent flame speed on the rms fluctuating velocity u' given in equation 3 since the two are proportional. A more specific statement is made here about the source of the turbulent flame speed in the finest scale of the turbulence.
Conclusions
The details of flame development in each cycle allow prediction of pressure release and mass burned fraction in the cycle. Flow-flame interactions through the effect of large-scale flows or turbulence result in a variety of flame shapes and speeds that cause observed mass burned rates.
The early flame kernel size and shape usually determine the later flame shape and the time to 1% mass burned. Later burn rate is controlled by the large-scale flame shape that results from an interaction between the early kernel shape, large-scale flow, and the combustion chamber shape. Turbulent flame speed is controlled primarily by the smallest scale of turbulence. These effects form a complete picture of flame development in this engine.
Acknowledgements
Discussions with Rod Rask on the various implications of the flame image data were very helpful. Experimental progress meetings with interested staff members of the Fluid Mechanics Department and the Engine Research Department also provided useful insights.
References
1. Schipperijn, F. W., Nagasaka, R., and Sawyer, R. F., "Imaging of Engine Flow and Combustion Processes," SAE Paper 881631, 1988.
2. Rassweiler, G. M., and Withrow, L., "Motion Pictures of Engine Flames Correlated with Pressure Cards," SAE Transactions, Vol. 42, No. 5, 1938, pp. 185-204.
3. Bates, S. C., "Flame Imaging Studies in a SI Four-Stroke IC Optical Engine," SAE Paper 890154, 1989.
4. Bates, S. C., "Cycle-by-Cycle Combustion Variation in a SI Four-Stroke Engine," SAE Paper 892086, 1989.
5. Bates, S. C., "A Transparent Engine for Flow and Combustion Visualization Studies," SAE Paper 880520, 1988.
6. Bates, S. C., "A Displaced-Line Velocity Diagnostic and Its Application in a Visualization Engine," Experiments in Fluids, Vol. 7, No. 5, 1989, pp. 335-343.
7. Kalghatgi, G. T., "Spark Ignition, Early Flame Development and Cyclic Variation in I. C. Engines," SAE Paper 870163, 1987.
8. Barton, R. K., Lestz, S. S., and Meyer, W. E., "An Empirical Model for Correlating Cycle-by-Cycle Cylinder Gas Motion and Combustion Variations of a Spark Ignition Engine," SAE Paper 710163, 1971.
9. De Soete , G. C., "Propagation Behavior of Spark Ignited Flames in Early Stages," International Conference on Combustion, Vol. I, Institute of Mechanical Engineers, 1983-3, Paper C59/83, 1983, pp. 93-100.
10. Herwig, R., Begleris, P., Zettlitz, A., and Ziegler, G. F. W., "Flow Field Effects on Flame Kernel Formation in a Spark-Ignition Engine," SAE paper 881639, 1988.
11. Mattavi, J. N., Groff, E. G., and Matekunas, F. A., "Turbulence, Flame Motion and Combustion Chamber Geometry - Their Interactions in a Lean-Combustion Engine," Paper c100/79, Institute of Mechanical Engineers Conference on Fuel Economy and Emissions of Lean Burn Engines, London, June 1979.
12. Mattavi, J. N., "Effects of Combustion Chamber Design on Combustion in Spark Ignition Engines," SAE Paper 821578, 1982.
13. Witze, P. O., "The Effect of Spark Location on Combustion in a Variable-Swirl Engine," SAE Paper 820044, 1982.
14. Groff, E. G., and Matekunas, F. A., "The Nature of Turbulent Flame Propagation in a Homogeneous Spark-Ignited Engine," SAE Paper 800133, 1980.
15. Matekunas, F. A., "Modes and Measures of Cyclic Combustion Variability," SAE Paper 830337, 1983.
16. Nakamura, A., Ishii, K., and Sasaki, T., "Application of Image Converter Camera to Measure Flame Propagation in S.I. Engine," SAE Paper 890322, 1989.
17. Taylor, C. F., The Internal-Combustion Engine in Theory and Practice, Vols. I, II, 2nd Edition, MIT Press, Cambridge, MA, 1985.
18. Metghalchi, M., and Keck, J. C., "Laminar Burning Velocity of Propane-Air Mixtures at High Temperature and Pressure," Combustion and Flame, Vol. 38, 1980, pp. 143-154.
19. Metghalchi, M., and Keck, J. C., "Burning Velocities of Mixtures of Air with Methanol Isooctane, and Indolene at High Temperature and Pressure," Combustion and Flame, Vol. 48, 1982, pp. 191-210.
20. Vafidas, C., Vorropoulos, G., and Whitelaw, J. H., "Effects of Intake Port and Combustion Chamber Geometry on In-Cylinder Turbulence in a Motored Reciprocation Engine," Fluid Flow and Heat Transfer in Reciprocating Machinery, ASME Publication FED- VOL. 62, 1987, p. 9-16.
21. Henriot, S., Le Coz, J. F., and Pinchon, P., "Three Dimensional Modeling of Flow and Turbulence in a Four-Valve Spark Ignition Engine - Comparison with LDV Measurements," SAE Paper 890843, 1989.
22. zur Loye, A. O., and Bracco, F. V., "Two-Dimensional Visualization of Premixed-Charge Flame Structure in an IC Engine," SAE Paper 870454, 1987.
23. Reuss, D. L., Adrian, R. J., Landreth, C. C., French, D. T., and Fansler, T. D., "Instantaneous Planar Measurements of Velocity and Large-Scale Vorticity and Strain Rate in an Engine Using Particle-Image Velocimetry," SAE Paper 890616, 1989.
24. Hinze, J. O., Turbulence, McGraw-Hill, New York, 1959.