Flame Imaging Studies of Combustion Completion
in a SI Four-Stroke Engine
40 Nutmeg Lane
Glastonbury, CT 06033
ABSTRACT
Direct flame imaging through a transparent cylinder liner has been used to study the final phase of lean combustion in a spark-ignition four-stroke optical engine. Two image-intensified video cameras record instantaneous lean flame radiation at two preset times to examine the structure and development of the flame as it approaches the wall to complete the flame travel. There is one peripheral spark plug on the side of the cylinder opposite the cameras, so that combustion completion images, capture only one flame thickness, and provide a unique map of flame intensity. These flames have highly structured intensity patterns on all of the scales associated with in-cylinder turbulence. Although the large-scale pattern of burning results from the flame shape early in the cycle, intensity variations of the flame images indicate that the burning rate varies significantly over the flame area on both large and small scales, indicating that the flame front is not a uniformly propagating sheet.
Key Words: Flame, internal combustion engine, premixed, wall, completion.
INTRODUCTION
At present, turbulent combustion provides the power for essentially all automotive transportation in the world. Although the value of being able to understand and model this combustion is obvious, the physics of turbulence and turbulent combustion are not known in general. The details of flame behavior in each cycle produce the cyclic variability in the combustion process, whereas the individual cycles combine to produce the overall combustion and the average power of the engine. It is necessary to be able to model the processes taking place in all phases of combustion to predict engine design and operation. The work described here concentrates on the physics of combustion completion
For typical engine combustion, a significant fraction of the mass of the air-fuel mixture is burned in a region near the wall after being compressed by the expanding flame during the early part of the cycle. Since the engine used in this study has a fully transparent liner, the flame distributed near the wall can be examined until combustion is complete. In this way the structure of the flame and the progress of the burn out can be studied in detail. Previous access to wall flames has been in unusual geometries such as square-piston engines and displaced heads, or through cylinder windows of limited axial extent.
ENGINE AND DIAGNOSTIC DESCRIPTION
Engine
The flame image data of this work were taken from a single-cylinder visualization engine described in detail elsewhere [6]. The major characteristics of this engine are representative of a modern four-stroke cycle spark-ignition internal combustion engine; global parameters for the engine are given in Table 1. The engine has a single-crystal sapphire liner with a flat quartz piston-top window in a extended piston. A firing run occurs when premixed propane and air is drawn through the engine from an intake tank of 50 cylinder-volumes.
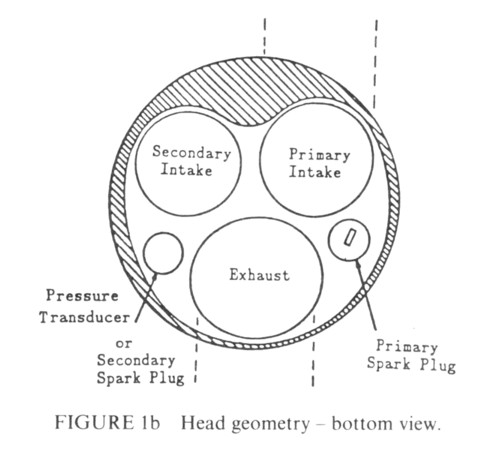
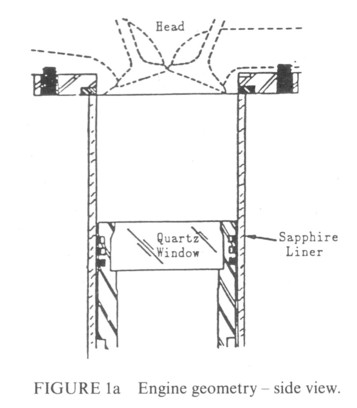
Shown in Figure la is the pent-roof head geometry and the transparent liner that extends to the bottom of the head. Figure 1b shows the location of the valves and the spark plugs. The secondary spark plug was replaced with a transducer to measure cylinder pressure for some experiments. The peripheral spark plugs are oriented vertically (parallel to the cylinder axis) and are electrically driven by a standard High Energy Ignition (HEI) system. The piston window diameter is 69.8 mm at its smallest section, compared with the 92 mm cylinder bore. Combustion chamber crevices consist of a 0.6 mm gap 5.0 mm deep around the piston, and a 3 mm deep, 0. 1 mm wide gap at the bore radius in the head.
TABLE 1. Engine parameters:
Bore:.............92.0 mm.............Piston:........Extended, flat-topped
Stroke:...........92.0 mm.............Fuel:..........Propane
Con rod length:..191.6 mm...........Compression ratio, C,:...9:1
Spark Duration = 1.5 ms..............RPM:......4000 max
Energy = 50 mJ
Heat:..........Three-Valve, Pent-roof
Two basic intake flow configurations were used; a throttle in the secondary port at the entrance to the head is either fully open or fully closed while both valves operate normally. With the throttle closed ("1 -port" data) there is a mean Bottom- Dead-Center (BDQ swirl ratio of 1, whereas an open throttle setting ("2-port" data) gives very little mean swirl. In all cases the manifold absolute pressure (MAP) was adjusted to 0.75 atmosphere.
Flame Imaging Diagnostic
Flame behavior is studied by analyzing short exposure images of flame luminosity taken by two image-intensified Charge-Coupled Device (CCD) National Television Standards Committee (NTSC) video cameras. The flame imaging system is described in detail elsewhere [2,3,4]. Each digitized flame image is composed of a 512 x 512 pixel array with an eight-bit intensity scale and a resolution of a few pixels. The illustrations shown in this paper are significantly degraded from those used in data analysis as a result of the decreased resolution and contrast variations accumulated after the multiple stages of reproduction. The images can be correlated with pressure data and mass burned fraction (MBF) using techniques similar to those described in [9].
Each image records the spatial variation of the visible flame radiation integrated along a line of sight. Line drawings of the engine background pattern are usually superimposed on the images to aid interpretation. This is done for each sequence of cycles with the same relative location in each cycle using commercial image processing software.
Flame Image Geometry
The images shown in this work were taken with a specific combustion geometry appropriate to the study of combustion near the wall. Peripheral ignition at the primary spark plug on one side of the chamber is used with cameras that view the combustion through the wall on the opposite side from the spark (Fig. 1). For this peripheral ignition, the flame quickly reaches and burns out at the closest wall long before it reaches the far wall where it is inspected by the cameras. Consequently, images late in the cycle include only one flame front near the camera-side wall.
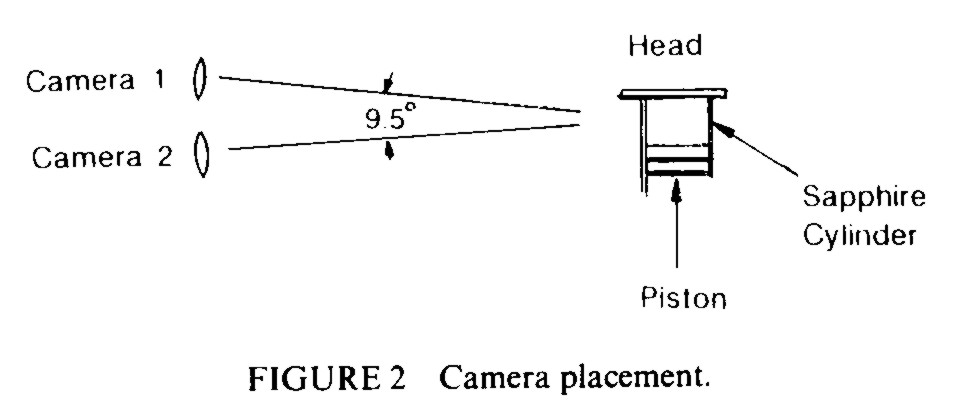
The cameras are mounted as close together as possible, one above the other (Fig. 2), to give similar views of the flame through the wall. The time development of combustion in each cycle is examined by gating on the upper camera at 50 crankangle degrees (deg-CA) ATDC (after top dead center) and the bottom camera at a later time in the cycle. The exposure period is short compared with flame development times. There is only one set of two images for each cycle because the cameras operate at the standard video rate of 30 frames/s.
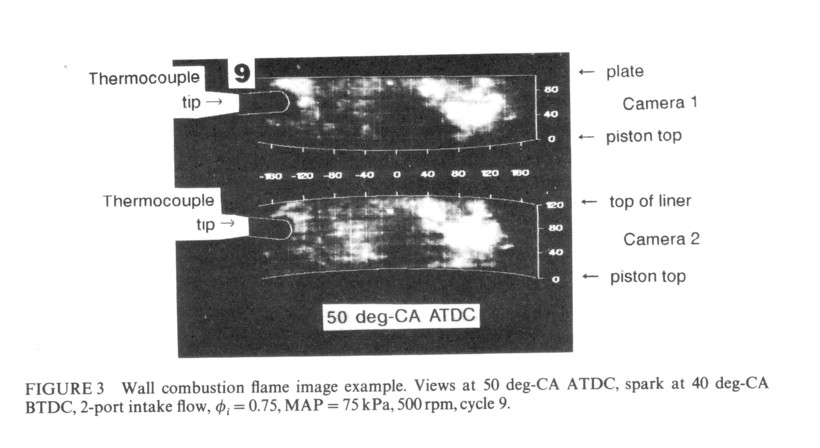
Figure 3 shows a typical pair of flame images, taken simultaneously at 50 deg-CA ATDC, with the viewing geometry of the separate cameras as shown in Figure 2. (The 9 in the upper left indicates the cycle number in a series of 50 cycles). Reference lines have been superimposed on the flame images to put them in the proper geometric context. The bottom of each flame image is bounded by a line representing the top edge of the piston, just as the top of the flame image of the lower camera is bounded by a line representing the inside top of the liner at the bottom of the head. The view of the upper camera is cut off at the top by a structural plate at the bottom of the head. The imaged flame emission intensity has been contrast-enhanced to give both maximum dynamic range and similar intensity levels in the two images
A rectangular grid has been superimposed on each image as if it were attached on the inside of the cylinder wall and viewed by each camera. This allows the position of flame structures to be easily compared between the two images, with spacing between the grid lines measured in pixels. The numerical labels on the grids indicate pixel numbers and will be used to identify regions of the images. As a result of the camera viewing angles, the image of any flame structure that is not at the wall will be displaced downward in the grid for the lower camera view and upward in the grid for the upper camera view. These images have been calibrated for their spatial scale; 5 pixels correspond to 1.0 mm in the flow. The lines in the image at the upper left show the tip of a surface thermocouple probe that obscures a small part of the image.
Light from a flame near the wall at both sides of an image (right and left edges) is refracted out of the camera view by the sapphire. Ray tracing through the sapphire cylinder wall shows that the light rays from the extremes of both sides of the cylinder are internally reflected and do not reach the camera lens. Because the flame images fade away on both sides because of refractive effects, the images do not record the full lateral extent of the flame. For this reason, any structures visible at the right and left edges of the images do not represent boundary effects in the cylinder. Right and left grid boundaries have been left out of the images for this reason.
WALL COMBUSTION - BACKGROUND
To properly explain the analysis of flame images of the final phase of combustion in a typical automotive engine, it is necessary to first describe the physical processes that are involved. For a typical combustion chamber without a piston bowl, combustion completion always takes place along the cylinder wall as a result of the geometry of single ignition followed by radial flame expansion.
The most important characteristics of combustion completion relate to the effects of the wall on the burning process. The wall limits gas expansion, constrains all flows, and forms a relatively low-temperature solid boundary that cools the gas. All of these factors change the fundamental behavior of the combustion compared with that of a flame propagating freely across the chamber. Since wall effects dominate burning during this final phase of combustion, the term wall combustion will be applied to the completion of combustion, although the term is more often applied to steady-state flames near a porous wall in laboratory experiments. Wall combustion analysis is important for the study of overall engine behavior, since a significant fraction of the mass in the cycle is burned during this process.
Although wall combustion encompasses a large part of the mass burned in the cycle, it is not clear how well wall combustion is treated by current 3-dimensional models with typically coarse grid resolution. Previous flame imaging studies suggest [7,9] that calculated combustion behavior may not be particularly sensitive to wall modeling due to the following: the integral and ensemble-averaged nature of the results (pressure histories); the early determination of the overall phasing of the combustion in the cycle; and the observation that the level of small-scale turbulence at the start of combustion determines flame speed.
There are characteristics of the wall combustion that are crucial for engine operation, however. The most important of these is knock, which arises from autoignition of the bulk mixture near the wall and limits the design compression ratio of most engines. Also important is how well the flame, shape matches the chamber shape [3], leading to changes in the final burn time and cyclic variation. Furthermore, wall combustion determines the behavior of most partial-burn cycles.
The transition from bulk combustion to wall combustion is indefinite during the time when the thickness of the unburned gas layer near the wall steadily and nonuniformly shrinks. For optimally phased combustion (MBT) peak pressure occurs 10 to 20 deg-CA after TDC, at which time somewhat more than half the mass is burned, and the flame is approaching the wall. In front of the flame, the wall thermal boundary layer is growing, the temperature of the unburned gas has risen due to compression by the expanding flame, and the flows in front of the flame front are progressively more compressed and constrained by the solid boundary. The flame propagation speed has decreased from its highest value, dominated by the gas expansion speed in the middle of the volume burn, to a speed more dependent on the turbulent burning rate.
The flame propagation speed depends on a number of separate effects. The two major parts arise from the expansion of the fuel-air mixture as it is burned, and the burning rate of the flame itself. Another contribution is the addition of flame area due to flame wrinkling [10] and the increase in area of an expanding convex surface. This surface may initially be either spherical or elliptical, or cylindrical after the flame has hit the piston.
The gas expansion velocity is controlled by the density differences across the flame, which in turn are determined by the temperature ratio across the flame. The unburned gas has been heated from its initial mixture temperature by the compression from piston motion and burned-gas expansion. The burned gas behind the flame has been slightly cooled from its flame temperature due to the work done to compress the gas in the cylinder and move the piston. This behavior of the pre- and post-flame gases is well understood and depends on the overall air-fuel mixture properties.
The turbulent flame speed and its dependence on flow and mixture parameters are much less well understood. Flame speed is usually derived from flame images and pressure data by combining the mass burn rate, mb, calculated from a heat release analysis with a measured mean flame area, Af, to give a burning speed:
Sb = Mb/PuAf
where Sb is the turbulent burning speed and pú is the unburned gas density. Sb is usually correlated with the turbulence intensity (u) and the laminar flame speed (SL) in an equation similar to
Sb = SL + 4ú
This correlation breaks down for the early flame and for combustion completion [7], but it indicates that the basic contributor to the turbulent flame speed is the rate of turbulent entrainment, unless this rate is not large enough to dominate the laminar flame speed.
The flame itself affects 'the turbulence directly ahead of it, and the flows in the unburned mixture have been studied and measured experimentally [1,8,15]. In the case of engine flames where the large scale flame shape is usually maintained throughout the middle portion of the volume burned [2, 3, 4], it seems probable that the primary effect of the flame is the compression of the flow in front of it.
In the compressed unburned gas the temperature and consequently the viscosity are both higher than they were before the flame expanded and the cylinder pressure increased; the flows ahead of the flame have also been compressed to smaller scales but have similar velocities (conservation of momentum). Thus, dissipation has increased greatly due to a combination of the smaller scales and higher density. At the same time the laminar flame speed has increased due to the increase in unburned gas temperature through the relationship [11,12].
SL = SLO(Tu/T0)x(P/P0) β(1.0 - 2.1f)
Where x and β are constants, T is the gas temperature, p is the pressure, 0 refers to atmospheric conditions, u refers to the unburned gas, and f is the diluent mass fraction. For lean propane-air mixtures x = 2.2 and β = 0.23. The dependence of SL0 on equivalence ratio (φ) is given by:
SL0 = 38.31 + 24.84(φ - 1) - 153(φ - 1)2
These relationships indicate that the laminar flame speed is very sensitive to the unburned gas temperature, which changes a great deal as the flame approaches and finally reaches the wall.
It is assumed in this work that combustion takes place in thin, wrinkled flames. All previous work in this engine supports this assumption, and other work using 2-D laser sections of engine combustion also indicate that this is the case [13].
Because of the strong dependence of the laminar flame speed on temperature, the thickness of the wall thermal boundary layer is an important quantity. The fluid near the cylinder wall develops differently in different regions of the cylinder. In the clearance volume both turbulent thermal diffusion and increasing gas temperature tend to increase the thickness of the thermal boundary layer while compression of the end gases during combustion tends to decrease its thickness. Below the clearance volume, the boundary layer grows rapidly only when the wall begins to be exposed to significant turbulent or mean flow as the piston moves down. Near the piston, the boundary layer is dominated by crevice gases emerging from around the piston.
WALL COMBUSTION DATA
Data Description
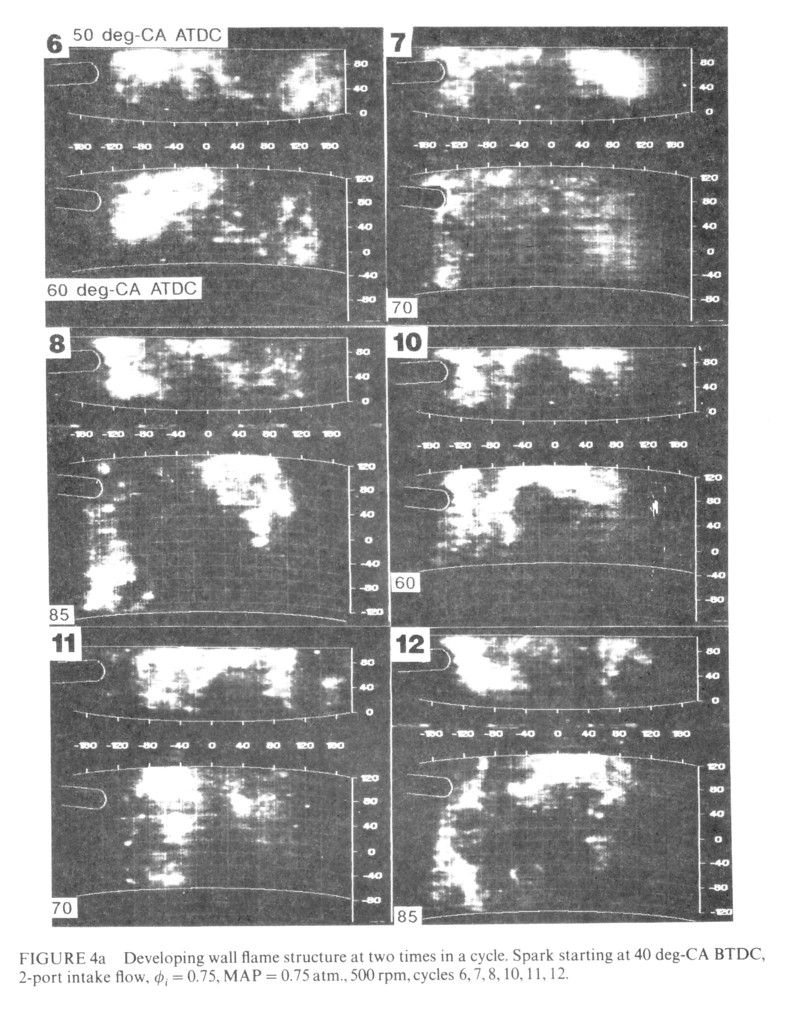
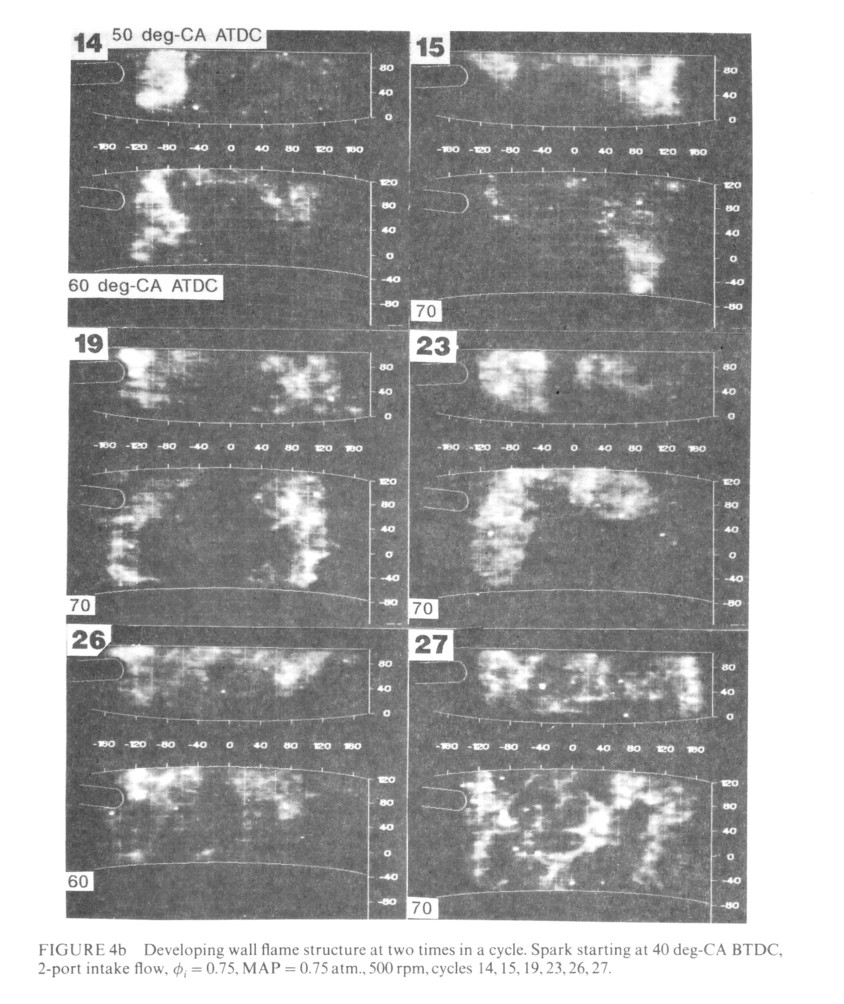
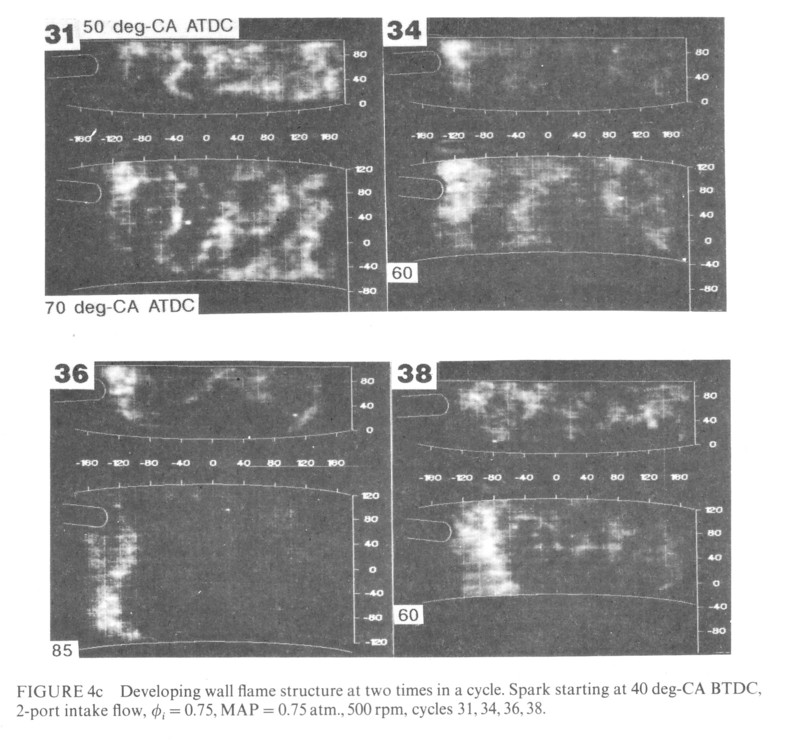
To study the development of the flame on the wall, the engine was operated using a lean mixture with single ignition at the primary spark plug. The engine speed was 500 rpm, the MAP was 75kPa, and φi was 0.75. The results presented in this work are a necessarily small sample of the entire data set. Most of the data has been chosen as a single representative example of a generic characteristic of the data and is shown together with the discussion of the relevant point. However, to show overall behavior of wall combustion, an extended set of data is given first (Fig. 4).
For the above engine operating conditions, 2-port intake flow was used with a spark beginning at 40 deg-CA BTDC to give significant burning late in the cycle. Mass Burned Fraction (MBF) curves based on cylinder pressure indicate that significant heat release ends near 90 deg-CA ATDC. Of these cycles some are complete burns and others are partial burns; combustion often oscillates from one to the other as a result of varying amounts of residual gas from the previous cycle [2].
Figures 4a-c show dual flame from 16 selected cycles of a 50 cycle run done under the above conditions. The number shown at the upper left of each image indicates its cycle number in the run of 50 consecutive cycles. The upper camera exposures were always taken at 50 deg-CA ATDC (2 deg-CA duration) while the lower camera exposures were delayed 0, 10, 20, or 35 deg-CA relative to that of the upper camera. For instance, the lower exposure in cycle 6 was taken at 60 deg-CA ATDC which corresponds to a delay of 10 deg-CA. The numbers at the lower left of all lower exposures (60,70, or 85) indicate the crankangle of that exposure (delayed 10, 20, or 35 deg-CA from the upper exposure). The 16 cycles presented are only those that show the time development of the wall combustion. Cycles with simultaneous dual exposures (0 delay) are not included, and cycles are not included if combustion is complete (a result of richer mixture caused by residual fluctuations). Fully burned regions are identified by uniformly low intensity, while radiation from the burning turbulent flame results in regions of highly structured intensity. The faint, wide horizontal striations aligned with the piston-top line are caused by-compression ring debris on the inner wall.
This data set forms the foundation for analyzing many of the effects of wall combustion. It illustrates the overall distribution of flame radiation intensity, its development in time, its variation in sequential cycles, the variety of scales involved, and other characteristics which will be discussed below. Experience in interpreting the intensity patterns in the images has been developed during this and past work, and effects discussed below may be less clear to a reader with less flame imaging experience.
The dual simultaneous images (both cameras exposed at 50 deg-CA ATDQ shown in Figure 3 are from this sequence (cycle 9) and they illustrate some of the difficulties encountered when analyzing this data. Because these images were taken at the same time, they obviously measure the same flame. The overall structure of the intensity in each image is similar, but the images show differences in form and detail. The most obvious similarities in the images are the bright dot at the top center and the size and shape of the bright region at the right center of the images. The bright dot is just left of 0 on the horizontal axis, slightly above 100 in the top image, and slightly below 100 in the bottom image (the y-position shift indicates the bright dot is not on the inner surface of the cylinder). Very sharp small-scale features such as this bright dot are easily compared from one image to the next. The bright region at the right center of the images is also relatively easy to compare in the two images. It has a rather large lower lobe (60 to 140 in the horizontal direction and 40 to 80 in the vertical direction) with a small spot of bright to the upper right and a larger bright region to the upper left. Although the specific shape changes between the two images, the general form is clearly similar. Images from the two views are distorted by perspective differences in camera viewpoint and different brightness scales in each image. A minor effect is the degradation in both gray scale and resolution of the images that occurs during reproduction for publication. None of the observations discussed here are dependent on such a change in the fine detail of the images.
The structures in the upper left of the images are an example of the amount of ambiguity that can be introduced between two images of the same flame from the two cameras with different perspectives.. The upper view shows a moderately strong bright area above and to the right of the temperature probe. In the lower image, the area is much reduced in size with only the region very near the probe showing much intensity at all. In the lower image, the region from - 40 to - 80 contains a wispy cloud-like structure of rather low intensity with the brightest portion in the lower half. In the upper image, the wispy structure is not clearly visible, and there is more intensity towards the top of the image. These differences arise from two factors. The different viewpoint of each camera results in different line-averaged intensities for small-scale flame structures. If a small structure is better aligned with the line of sight of one camera than with the other camera, the image with the better structure-to-camera alignment will be brighter. This causes small-scale variations in intensity to change greatly and show up or not show up relative to the background intensity. The second factor is that the cameras have slightly different sensitivities, so that intensity compensation using contrast enhancement cannot correct the entire intensity range. This causes structures to fade out more rapidly in one image relative to the other image. For these reasons, the analysis of the time development of flame structure in the images in this work will not consider subtle differences in the images. Image interpretation will concentrate on clearly defined structures and/or geometrical shape.
An example of the intensity variation between cameras is shown by the images of cycle 8 in Figure 4a. In this case the bright patch on the center right of the lower image is barely visible in the upper image. The absolute intensities in the second image are significantly decreased relative to the upper image because the emitted intensity is strongly pressure dependent, and the pressure is much less at 80 deg-CA ATDC than at 50 deg-CA ATDC. The structure on the left has become of comparable intensity to that on the right in the later image, whereas in the earlier image the structure on the left is much brighter. The image normalization procedure causes a brightening of the right side structure, while the actual development is a dimming of the structure on the left. One must depend more on geometry and less on intensity to make deductions about flame behavior based on these images. Much information about the in-cylinder flows near TDC compression and the consequent flame development has been inferred in previous work from imaging the growth and distortion of the flames in this engine [2,3,4,5].
Two basic flame behaviors were found in this engine in the previous work, depending on the port configuration used [3,4,5]. For intake flow through the primary intake valve ("1-port" configuration) the flame front shapes were either flat or round, changing with the interaction of the flow near the spark plug with the early spark kernel. These flames have rotated clockwise in the view of Figure I b as a result of swirl ratio that can be anywhere between 0 to 2 for any specific cycle. For the 2-port intake flow, the flames were basically round, but slightly elongated toward the secondary spark plug. Flame propagation was much slower for the 2-port case with approximately zero cycle-averaged swirl ratio, although the swirl also changed from cycle to cycle. In both cases the flame fronts were approximately vertical (aligned with the cylinder axis) in the latter part of combustion.
Because the large-scale flame shape usually remains the same as the flame traverses most of the volume in the cylinder, the generic radial flame shapes found early in the cycle in the previous work can be used to predict how the flame will be distributed along the wall during the final phases of combustion [3,4,5]. One work [3] gives wall combustion data for the 1-port case, while the others give wall combustion examples for the 2-port case at the same engine operating conditions as for the images of Figure 4. Early and later images showing the flame shape development resulting in the 50 deg-CA ATDC flame structure [4], and the flame structure at 90 deg-CA ATDC [5] complement the data presented here. The data images of Figure 4 show the time development of wall combustion and give more information about the detailed structure of the wall combustion. All of these images show a consistent behavior which is investigated in greater detail below.
Flame Structure Scale Filtering
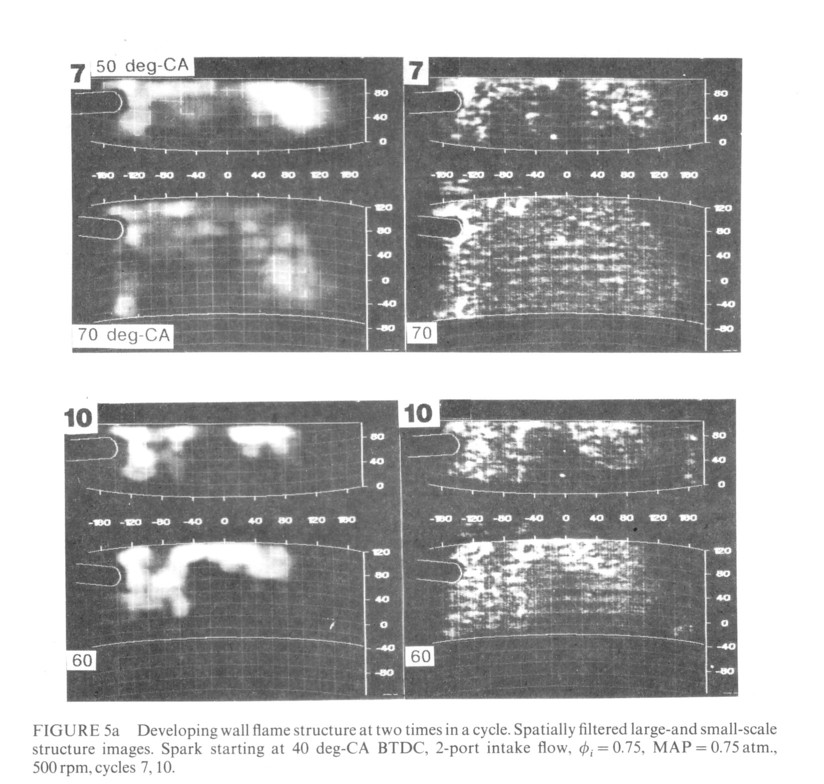
An image processing technique was developed to separate the large and small scales of the image intensity in order to study the development and distribution of large and small scale structures separately. The individual steps in the technique are standard image processing functions [14].
Each original flame image undergoes an erosion based on a three-pixel-square kernel, followed by a low-pass filter based on a seven-pixel-square kernel. The low-pass filter removes much of the high-frequency structure in the image by averaging over the kernel, but causes a spreading of the higher intensity regions. The erosion process compensates for this low-frequency structure size increase. The erosion-low-pass process is performed twice, and a final image dilation then returns the intensity structures to their approximate original extent, giving a map of the large-scale structures in the flame images. This image is then subtracted from the original image to obtain a high-pass-filtered flame image where only the small-scale structures remain.
This process was developed as a result of considerable image-processing experimentation. The high-pass filtered images were tested by verifying that the background levels of high-passed images were nearly constant over an entire image, indicating that all significant large scale structures were removed. Filtered images are presented in Figure 5 and will be discussed below.
WALL COMBUSTION BEHAVIOR
Burning Spatial Distribution
One major characteristic of the flame images shown in Figure 4 is the overall distribution of 6urning. The brighter portions of the region inside the cylinder are the areas where burning is still taking place, whereas the dark areas of uniform intensity are regions where the flame has burned all the way to the wall and extinguished.
Typically, the central part of the flame has reached the wall first and burned out. As discussed above and elsewhere [3,4,5] the elongation of the flame toward the secondary spark plug for the two-port intake configuration, coupled with the fact that the flame maintains its shape as it grows, causes the flame to reach the center of the wall first and burn out there. This is the cause of the darker regions near the center of the cylinder in the images of Figure 4. The locations of the centers of these regions also vary to the left and right of center of the images from cycle-to-cycle. This is presumably caused by the variations in swirl from cycle to cycle that have been shown to exist [3].
One interesting note is that when cycles that exhibit incomplete combustion are imaged, flames are still visible at BDC using the image intensified cameras. These flames extend throughout the cylinder volume, although their location varies from cycle to cycle. It might be expected that the gas expansion would totally quench the flame, but this is not the case.
Another feature of the large-scale combustion is that the part of the flame at the left of center almost always extends down to the top of the piston, while that to the right of center often does not. This seems to be a result of varying large-scale three-dimensional flows, but it could also be an effect of the head asymmetry. The flame on the right side of the image has passed the lower side of the pentroof whereas the flame on the left side has passed through the center of the cylinder and the top of the pentroof, possibly causing asymmetry in the flame development.
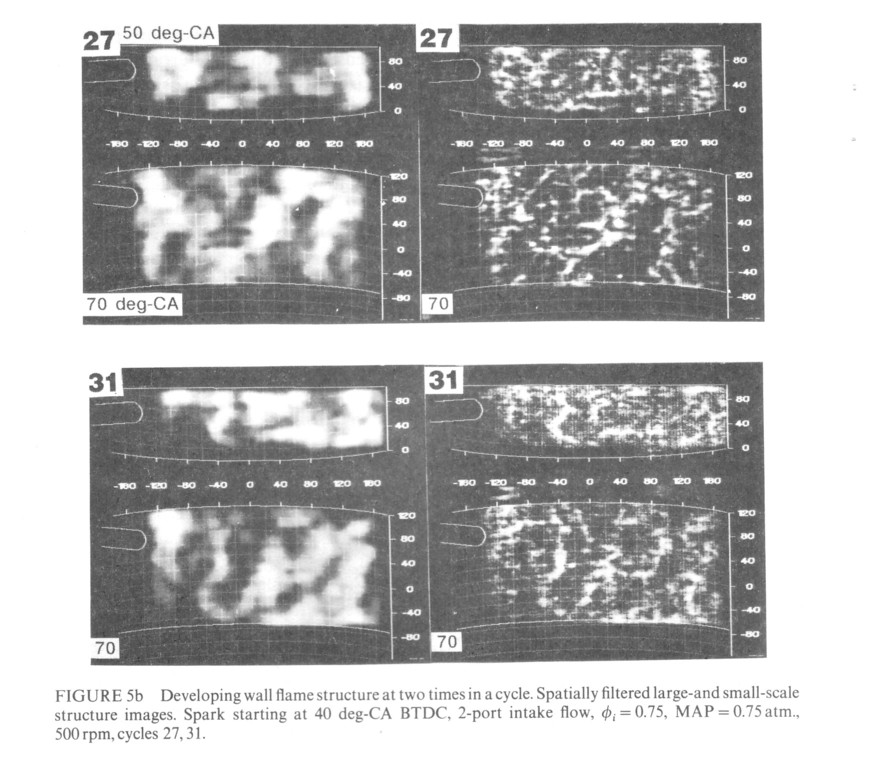
Spatially filtered images for selected cycles are given in Figure 5. For each cycle the large scales are shown in the left pair of images and the small scales in the right pair. The large-scale images are very similar to the images for the same cycles shown in Figure 4 except that the contrast between flame and non-flame regions is enhanced somewhat. A characteristic of these images is that the areas of small-and large-scale structures coincide. This implies that the burning occurs across a range of scales rather than at one particular scale (to the scale resolution available in Fig. 5). A second characteristic of the images is the intensity fluctuation noise in the small-scale structure images that is quite prevalent in the second, dimmer images. This noise fades into the background in the original images (as in Fig. 4), but the noise is identified and highlighted by the filtering process. This is basically a signal-to-noise limit in the images and makes the small-scale delayed images harder to interpret.
Burn Rate Variation
In some of the cycles in Figure 4 there are extensive regions of the flame that burn out between the first exposure and second exposures. Cycles 7, 8, 15, 19, and 36 exhibit this behavior. All of these images have the characteristic that the area which is burned out between the first and second image is brighter than the rest of the flame in the first image. In cycle 7 (also seen in Fig. 5a) and cycle 15 the large bright region in the right of the first image has almost disappeared from the later image. In cycles 8, 19, and 36 the first images show strong burning above and to the right of the temperature probe. In the second images of cycles 8, 19, and 36 burning near the temperature probe is finished.
The implication of the burn out of the brighter areas is that there are significant large scale variations in the local burning rate. Figure 5a shows the low and high frequency images of cycle 7. In these images it can be seen that the burn out includes all scales in the upper right portion of the image, and that the bright region is associated with the large-scale behavior of the flame. In the 50 deg-CA image, the small-scale character of the burn out region is not different from the rest of the flame area (left side of image), indicating that the burn out is probably not a result of an increase in burning area caused by more fine-scale convolutions in the flame front. Since these cameras cannot resolve the finest turbulence scales it is possible that there is more fine scale structure in the bright regions, but this seems unlikely because of the similarity of the intermediate scale structures.
In other cycles it appears that the region where burning is occurring increases from the first to the second image. In cycle 10 the area at the top of the second exposure has filled in so that the two rather distinct regions at the top of the first have merged. Cycle 12 also shows increased burn area at the top center of the second image. Cycle 38 shows a large area just to the right of the temperature probe that extends from the top to the bottom of the second image.
It was assumed in earlier flame imaging work that intensity variations were primarily caused by line-integral measurements of convolutions in the uniform thin flame front [2,3,4]. If this were true, the brightest regions of the single flame front images such as those shown in Figure 4 would be thin bands where the three-dimensional flame front was parallel to the line of sight. Such convolutions have been shown to exist in engine wall flames [13]. The images of Figure 4 instead are dominated by extended area bright regions, and even the small scale flame structures have more round than narrow shapes. These characteristics indicate that strong burn rate variations along the flame front dominate the combustion process and dominate convolutions of the flame front. These burn rate variations are likely the consequence of development of earlier convolutions.
Flame Structure Development
In spite of the perspective and intensity differences in the flame images in Figure 4, there are some identifiable structures that persist in both images for some cycles. The flame images of cycles 6, 10, 14, 23, 31, 34, and 36 contain the most obvious examples. These structures tend to be larger vertical structures as a result of the vertical change in perspective between the cameras. They occur more frequently in the images that are separated by shorter intervals (4: 10 deg-CA, 2: 20 deg-CA, 1: 35 deg-CA) because these structures are being distorted by the evolving flow in the cylinder and consumed by the combustion.
There are two basic types of identifiable structures. The first is a clear boundary between burning (bright) and burned (dark) regions such as that seen in cycle 10. The second is a bright filamentary structure with bends such as that seen in cycle 3 1. The overall regions maintain similar shapes, because only the completion of burning can eliminate portions of the image with structured intensity. The turbulence does not smear out these images between the first and second exposures.
Given the existence of extended identifiable vertical flame structures, the distortion of these structures with time can be used to examine any fluid motion in relation to the piston motion. The bright hook structure at the lower left center of the images in cycle 31 (Fig. 4c) can be used as an example. In this case, at 50 deg-CA the top of the hook is located axially on the grid at 80 pixels and the bottom is located axially at 30 pixels. At 70 deg-CA the top of the hook is at 40 pixels axially and the bottom is at -60 pixels. This implies a stretch of 100%. Over the same interval the piston has moved from 0 to -80 pixels with an overall displacement of 200 pixels from TDC, implying a stretch of 66%. This stretch is in reasonable agreement with the distortion of the hook structure.
Hot Spots
Throughout the images presented in this work, there are small high-intensity dots. These have appeared in all previous imaging work in this engine [2,3,4,5] and have been reported anecdotally in all other similar flame imaging experiments. It has been postulated that these spots are caused by contamination of the air-fuel mixture by dust or oil drops.
In this work an explanation for the existence of these spots is more perplexing. The piston uses graphite rings without any oil, and it was determined that there were no oil leaks from the head, so engine oil droplets cannot be the cause of these hot spots. Also, since the air-fuel mixture is purely gaseous (premixed propane and air) there is no possibility of liquid fuel droplets in the intake flow. The air supply may have some contamination, since it is shop compressed air with some oil in it, but the spots still occurred after the air supply had undergone long periods of stagnation, during which any drops should have settled out.
Examining the change in location of the spots in the separate camera views implies that the spots are near the flame front. These images also indicate that the radiation from the spots is not long-lasting. The source and significance of these spots remain unknown, but they are clearly a pervasive and unstudied phenomenon.
CONCLUSIONS
Combustion completion in internal combustion engines is characterized by flames that have highly structured intensity patterns on all of the scales associated with turbulence. Although the large scale pattern of burning results from the flame shape early in the cycle, intensity variations of the flame images indicate that the burning rate varies significantly on both large and small scales over the flame area at the end of the cycle near the wall. Many details of the flow patterns and flame propagation can be deduced from flame images during combustion completion.
ACKNOWLEDGEMENTS
This paper could not have been published without the much-valued long term assistance of Rod Rask of the GM NAO R & D Center Engine Research Dept. During research and preparation numerous discussions with him on the various implications of the flame image data were very helpful. This work was performed at the GM NAO R and D Center, Engine Research Dept. Warren, MI, 48090-9055.
S.C. Bates, Combust. Sci. and Tech., 105, 1-18, (1995)
REFERENCES
1. Arcournanis, C. and Whitelaw, J. H.. Fluid Mechanics of Internal Combustion Engines: A Review. In International Symposium on Flows in Internal Combustion Engines-III, T. Uzkan, W. G. Tiederman and J. M. Novak (Eds.). ASME, New York, p. I (1985).
2. Bates, S. C. Flame Imaging Studies in a Spark-Ignition Four-Stroke Internal Combustion Optical Engine, SAE Paper 890154 (1989).
3. Bates, S. C. Flame Imaging Studies of Cycle-by-Cycle Combustion Variation in a si Four-Stroke Engine. SAE Paper 892086 (1989).
4. Bates, S. CFlame Imaging Studies of Flame Development in a SI Four-Stroke Engine. In Dynamics of Deflagrations and Reactive Systems: Flames, A. L. Kuhl, J. -C. Leyer, A. A. Borisov, and W. A.Sirignano, (Eds.), Progress in Astronautics and Aeronautics, 131, AIAA, Washington, DC, ISBN 0-930403-95-9 (1991).
5. Bates, S. C. Further Insights into SI Four-Stroke Combustion Using Flame Imaging. Combustion and Flame, 85, 33 1 (1991).
6. Bates, S. C. A Transparent Engine for Flow and Combustion Visualization Studies. SAE Paper 880520 (1988).
7. Groff, E. G. and Matekunas, F. A. The Nature of Turbulent Flame Propagation in a Homogeneous Spark-Ignited Engine. SAE Paper 800133 (1980).
8. Hall, M. J., Bracco, F. V. and Santavicca, D. A. Cycle-Resolved Velocity and Turbulence Measurements in an IC Engine with Combustion. SAE Paper No. 860320 (1986).
9. Rassweiler, G. M. and Withrow, L, Motion Pictures of Engine Flames Correlated with Pressure Cards. SAE Transactions, 42(5), 185-204 (1938).
10. Mantzaras, J., Felton, P. G. and Bracco, F. V. 3-D Visualization of Premixed-Change Engine Flames: Islands of Reactants and Products; Fractal Dimensions; and Homogeneity, SAE Paper 881635 (1988).
11. Metghalchi, M. and Keck, J. C. Laminar Burning Velocity of Propane-Air Mixtures at High Temperature and Pressure, Combustion and Flame, 38, 143-154 (1980).
12. Metghalchi, M. and Keck, J. C.) Burning Velocities of Mixtures of Air with Methanol, Isooctane, and Indolene at High Temperature and Pressure, Combustion and Flame, 48, 191-210 (1982.
13. zur Loye, A. 0. and Bracco, F. V. Two-Dimensional Visualization of Premixed-Charge Flame Structure in an IC Engine. SAE Paper 870454 (1987).
14. Rosenfeld, A. and Kak, A. C. Digital Picture Processing, Second Edition, Academic Press (1982).
15. Witze, P. 0., Martin, J. K. and Borgnakke, C. Measurement and Predictions of the Precombustion Fluid Motion and Combustion Rates in a Spark Ignition Engine, SAE Transactions, 92,786-796 (1983).